Estimated Value: $58,000 - $135,000
3
Beds
1
Bath
1,040
Sq Ft
$91/Sq Ft
Est. Value
About This Home
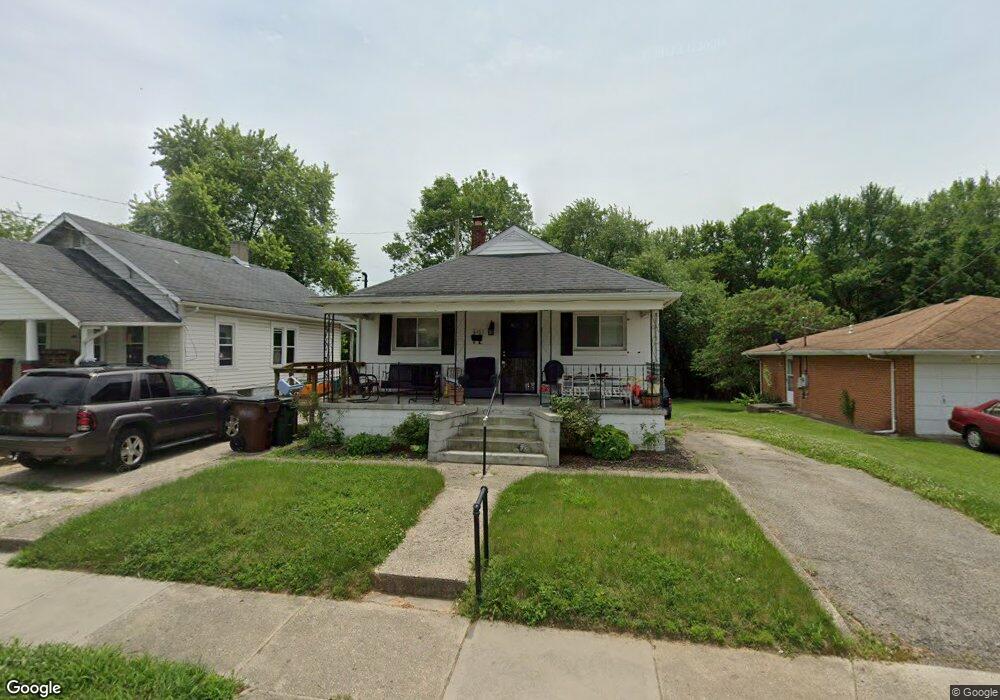
This home is located at 625 E 3rd St, Xenia, OH 45385 and is currently estimated at $94,573, approximately $90 per square foot. 625 E 3rd St is a home located in Greene County with nearby schools including Xenia High School, Summit Academy Community School for Alternative Learners - Xenia, and Legacy Christian Academy.
Ownership History
Date
Name
Owned For
Owner Type
Purchase Details
Closed on
Dec 1, 2021
Sold by
Coleman Derrick T and Jenkins Coleman Mallory
Bought by
Hall Jason B
Current Estimated Value
Purchase Details
Closed on
Feb 8, 2021
Sold by
Estate Of Marie A Coleman
Bought by
Coleman Derrick T and Hall Jason D
Purchase Details
Closed on
Nov 21, 2005
Sold by
Coleman Marie A
Bought by
Coleman Marie A
Purchase Details
Closed on
Nov 3, 2004
Sold by
Corbett Mildred L and Corbett Mildred
Bought by
Corbett Mildred L and The Mildred L Corbett Trust
Create a Home Valuation Report for This Property
The Home Valuation Report is an in-depth analysis detailing your home's value as well as a comparison with similar homes in the area
Home Values in the Area
Average Home Value in this Area
Purchase History
| Date | Buyer | Sale Price | Title Company |
|---|---|---|---|
| Hall Jason B | -- | None Available | |
| Coleman Derrick T | -- | None Available | |
| Coleman Marie A | -- | -- | |
| Corbett Mildred L | -- | -- | |
| Corbett Mildred L | -- | -- |
Source: Public Records
Tax History
| Year | Tax Paid | Tax Assessment Tax Assessment Total Assessment is a certain percentage of the fair market value that is determined by local assessors to be the total taxable value of land and additions on the property. | Land | Improvement |
|---|---|---|---|---|
| 2025 | $542 | $12,450 | $3,290 | $9,160 |
| 2024 | $542 | $12,450 | $3,290 | $9,160 |
| 2023 | $533 | $12,450 | $3,290 | $9,160 |
| 2022 | $470 | $9,370 | $2,990 | $6,380 |
| 2021 | $476 | $9,370 | $2,990 | $6,380 |
| 2020 | $7 | $9,370 | $2,990 | $6,380 |
| 2019 | $7 | $7,420 | $2,010 | $5,410 |
| 2018 | $7 | $7,420 | $2,010 | $5,410 |
| 2017 | $7 | $7,420 | $2,010 | $5,410 |
| 2016 | $7 | $7,170 | $2,010 | $5,160 |
| 2015 | $4 | $7,170 | $2,010 | $5,160 |
| 2014 | $4 | $7,170 | $2,010 | $5,160 |
Source: Public Records
Map
Nearby Homes
Your Personal Tour Guide
Ask me questions while you tour the home.