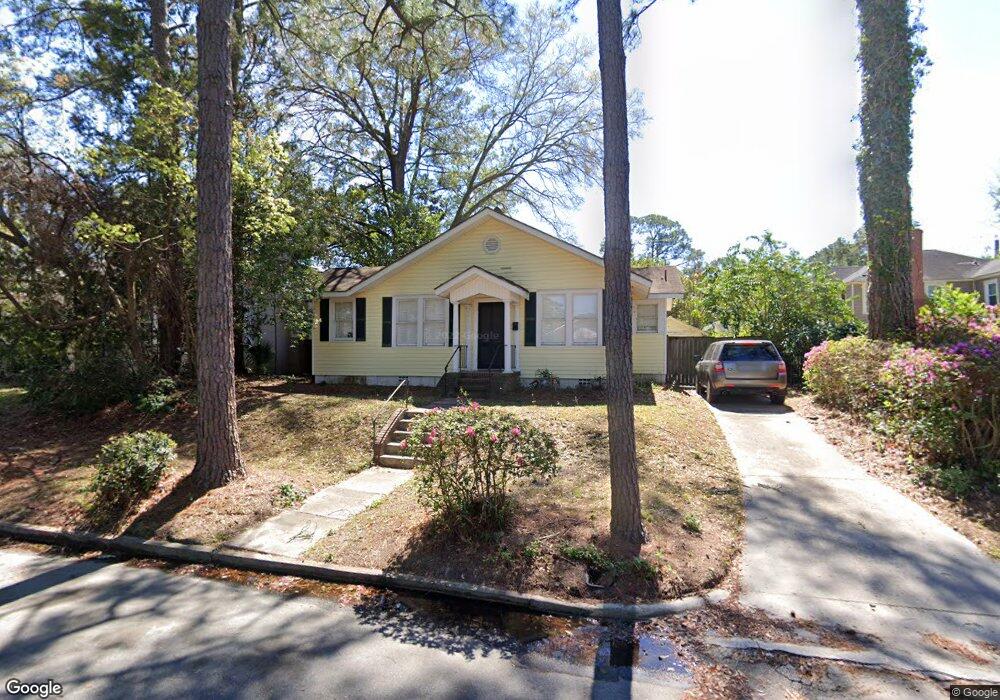
625 E 54th St Savannah, GA 31405
Ardmore-Gould Estates-Olin Heights NeighborhoodEstimated Value: $296,000 - $441,000
About This Home
This home is located at 625 E 54th St, Savannah, GA 31405 and is currently estimated at $355,276, approximately $318 per square foot. 625 E 54th St is a home located in Chatham County with nearby schools including Jacob G. Smith Elementary School, Myers Middle School, and Savannah Arts Academy.
Ownership History
We collect this data history from publicly available records. To have your information removed, we recommend requesting removal directly through your county’s website.
Purchase Details
Home Financials for this Owner
Home Financials are based on the most recent Mortgage that was taken out on this home.Purchase Details
Home Values in the Area
Average Home Value in this Area
Purchase History
We collect this data history from publicly available records. To have your information removed, we recommend requesting removal directly through your county’s website.
| Date | Buyer | Sale Price | Title Company |
|---|---|---|---|
| $159,950 | -- | ||
| -- | -- |
Mortgage History
We collect this data history from publicly available records. To have your information removed, we recommend requesting removal directly through your county’s website.
| Date | Status | Borrower | Loan Amount |
|---|---|---|---|
| Open | $127,960 |
Tax History
We collect this data history from publicly available records. To have your information removed, we recommend requesting removal directly through your county’s website.
| Year | Tax Paid | Tax Assessment Tax Assessment Total Assessment is a certain percentage of the fair market value that is determined by local assessors to be the total taxable value of land and additions on the property. | Land | Improvement |
|---|---|---|---|---|
| 2025 | $2,814 | $97,760 | $44,000 | $53,760 |
| 2024 | $21 | $91,080 | $44,000 | $47,080 |
| 2023 | $803 | $72,040 | $30,000 | $42,040 |
| 2022 | $1,678 | $68,000 | $30,000 | $38,000 |
| 2021 | $2,349 | $54,440 | $20,000 | $34,440 |
| 2020 | $1,674 | $54,560 | $20,000 | $34,560 |
| 2019 | $2,355 | $53,000 | $20,000 | $33,000 |
| 2018 | $1,569 | $49,680 | $20,000 | $29,680 |
| 2017 | $1,625 | $55,400 | $26,160 | $29,240 |
| 2016 | $1,556 | $53,320 | $26,160 | $27,160 |
| 2015 | $2,265 | $54,320 | $26,160 | $28,160 |
| 2014 | $3,240 | $58,360 | $0 | $0 |
Map
- 634 E 55th St
- 702 E 55th St
- 630 E 55th St
- 627 E 54th St
- 637 E 55th St
- 627 E 54th St
- 633 E 55th St
- 623 E 54th St
- 706 E 55th St
- 626 E 55th St
- 629 E 55th St
- 619 E 54th St
- 709 E 55th St
- 3904 Harmon St
- 3904 Harmon St Unit down
- 3904 Harmon St Unit up
- 625 E 55th St
- 707 E 54th St
- 624 E 55th St
- 711 E 55th St
Ask me questions while you tour the home.