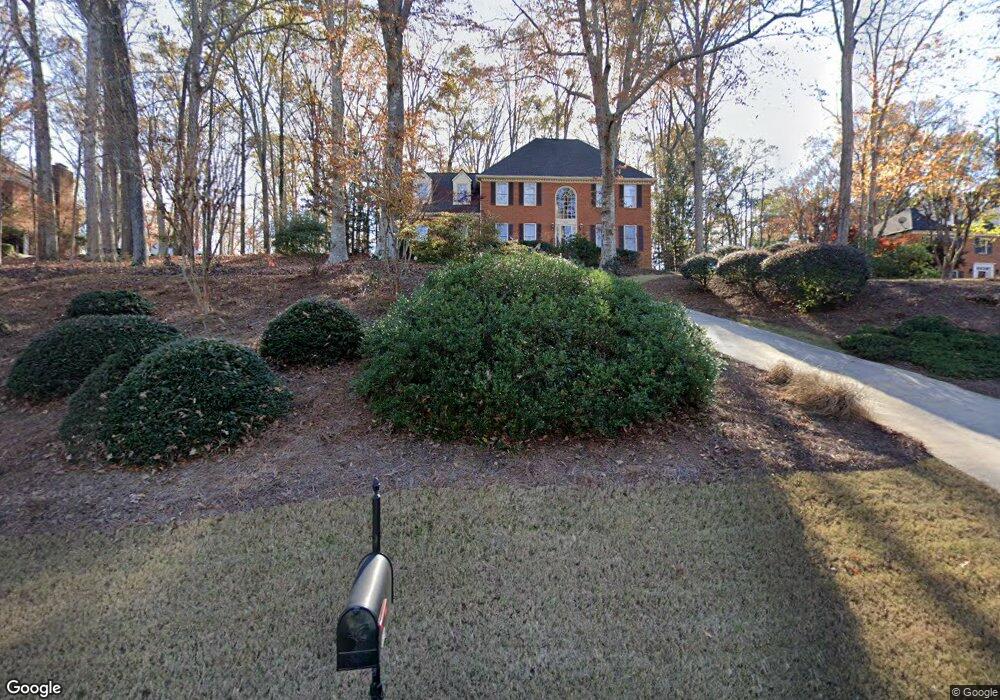
625 River Bottom Rd Athens, GA 30606
Estimated Value: $542,044 - $643,000
4
Beds
3
Baths
3,372
Sq Ft
$179/Sq Ft
Est. Value
About This Home
This home is located at 625 River Bottom Rd, Athens, GA 30606 and is currently estimated at $602,261, approximately $178 per square foot. 625 River Bottom Rd is a home located in Clarke County with nearby schools including Timothy Elementary School, Clarke Middle School, and Clarke Central High School.
Ownership History
Date
Name
Owned For
Owner Type
Purchase Details
Closed on
May 24, 2006
Sold by
Not Provided
Bought by
Fitzsimmons Michael J
Current Estimated Value
Home Financials for this Owner
Home Financials are based on the most recent Mortgage that was taken out on this home.
Original Mortgage
$215,000
Outstanding Balance
$124,549
Interest Rate
6.5%
Mortgage Type
New Conventional
Estimated Equity
$477,712
Purchase Details
Closed on
Nov 5, 2004
Sold by
Chalmers James H and Chalmers Carole C
Bought by
Cannon Residential Services Inc
Purchase Details
Closed on
Jun 15, 1995
Sold by
Monroe Joseph C and Monroe Denise M
Bought by
Chalmers James H and Chal Carole C
Purchase Details
Closed on
Aug 27, 1991
Sold by
Monroe Joseph C
Bought by
Monroe Joseph C and Monroe Denise M
Purchase Details
Closed on
Oct 27, 1989
Sold by
Cox Mary S
Bought by
Jones Terry O and Jones Rita G
Create a Home Valuation Report for This Property
The Home Valuation Report is an in-depth analysis detailing your home's value as well as a comparison with similar homes in the area
Home Values in the Area
Average Home Value in this Area
Purchase History
| Date | Buyer | Sale Price | Title Company |
|---|---|---|---|
| Fitzsimmons Michael J | $325,000 | -- | |
| Cannon Residential Services Inc | $210,000 | -- | |
| Chalmers James H | $222,000 | -- | |
| Monroe Joseph C | -- | -- | |
| Monroe Joseph C | $178,300 | -- | |
| Jones Terry O | $173,000 | -- |
Source: Public Records
Mortgage History
| Date | Status | Borrower | Loan Amount |
|---|---|---|---|
| Open | Fitzsimmons Michael J | $215,000 |
Source: Public Records
Tax History Compared to Growth
Tax History
| Year | Tax Paid | Tax Assessment Tax Assessment Total Assessment is a certain percentage of the fair market value that is determined by local assessors to be the total taxable value of land and additions on the property. | Land | Improvement |
|---|---|---|---|---|
| 2025 | $4,077 | $219,753 | $26,000 | $193,753 |
| 2024 | $4,077 | $199,555 | $26,000 | $173,555 |
| 2023 | $4,111 | $187,383 | $26,000 | $161,383 |
| 2022 | $3,911 | $160,592 | $26,000 | $134,592 |
| 2021 | $3,893 | $143,669 | $26,000 | $117,669 |
| 2020 | $3,790 | $136,097 | $26,000 | $110,097 |
| 2019 | $3,704 | $127,696 | $26,000 | $101,696 |
| 2018 | $3,702 | $127,538 | $24,000 | $103,538 |
| 2017 | $3,554 | $116,922 | $24,000 | $92,922 |
| 2016 | $3,522 | $114,640 | $24,000 | $90,640 |
| 2015 | $3,527 | $115,036 | $24,000 | $91,036 |
| 2014 | $3,511 | $113,099 | $24,000 | $89,099 |
Source: Public Records
Map
Nearby Homes
- 575 Vaughn Rd
- 115 Woodhaven St
- 184 Hillsborough Dr
- 450 River Bottom Rd
- 256 Cherokee Ridge
- 125 Mitchell Bluff
- 212 Huntington Shoals Dr
- 134 Bent Tree Dr
- 124 Pin Oak Ct
- 164 Lucy Ln
- 141 Huntington Shoals Dr
- 215 Claystone Trace
- 860 Mitchell Bridge Rd Unit 8
- 860 Mitchell Bridge Rd Unit 8
- 532 Huntington Rd Unit 7
- 470 Huntington Rd Unit 5
- 43 River Shoals Dr
- 240 W Huntington Rd
- 615 River Bottom Rd
- 635 River Bottom Rd
- 630 River Bottom Rd
- 180 River Bottom Place
- 659 River Bottom Rd
- 620 River Bottom Rd
- 150 River Bottom Place
- 575 River Bottom Rd
- 610 River Bottom Rd
- 136 River Bottom Cir
- 665 River Bottom Rd
- 1041 Saint Andrews Dr
- 175 River Bottom Place
- 650 River Bottom Rd
- 140 River Bottom Place
- 134 River Bottom Cir
- 565 River Bottom Rd
- 600 River Bottom Rd
- 675 River Bottom Rd
- 660 River Bottom Rd