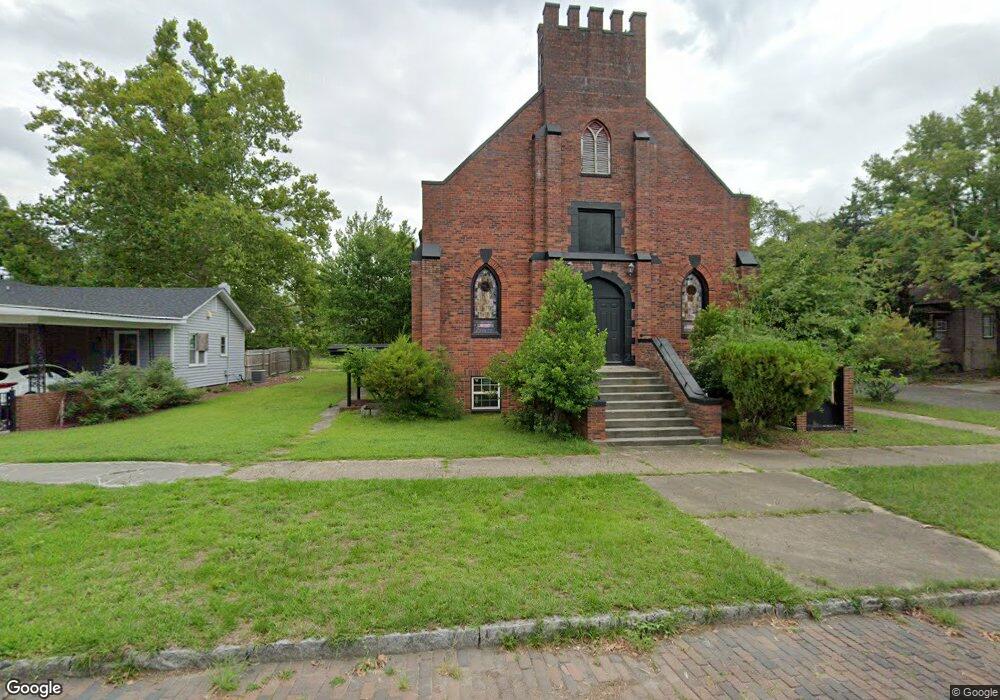
625 S 4th St Wilmington, NC 28401
Dry Pond-South Side NeighborhoodEstimated Value: $745,000 - $2,186,000
1
Bed
4
Baths
8,063
Sq Ft
$151/Sq Ft
Est. Value
About This Home
This home is located at 625 S 4th St, Wilmington, NC 28401 and is currently estimated at $1,213,649, approximately $150 per square foot. 625 S 4th St is a home located in New Hanover County with nearby schools including Snipes Academy of Arts & Design, Williston Middle School, and New Hanover High School.
Ownership History
Date
Name
Owned For
Owner Type
Purchase Details
Closed on
Sep 9, 2016
Sold by
Bon Bini Investments Inc
Bought by
Gravely Carly
Current Estimated Value
Purchase Details
Closed on
Oct 12, 2015
Sold by
Rich Robert L and Rich Allidease
Bought by
Bon Bini Investments Inc
Purchase Details
Closed on
Mar 17, 1994
Sold by
Mclean Magnolia H
Bought by
Rich Robert L Allidease J
Purchase Details
Closed on
Mar 1, 1975
Bought by
Mclean Magnolia
Create a Home Valuation Report for This Property
The Home Valuation Report is an in-depth analysis detailing your home's value as well as a comparison with similar homes in the area
Home Values in the Area
Average Home Value in this Area
Purchase History
| Date | Buyer | Sale Price | Title Company |
|---|---|---|---|
| Gravely Carly | -- | None Available | |
| Bon Bini Investments Inc | $192,100 | None Available | |
| Rich Robert L Allidease J | $122,500 | -- | |
| Mclean Magnolia | $38,000 | -- |
Source: Public Records
Tax History Compared to Growth
Tax History
| Year | Tax Paid | Tax Assessment Tax Assessment Total Assessment is a certain percentage of the fair market value that is determined by local assessors to be the total taxable value of land and additions on the property. | Land | Improvement |
|---|---|---|---|---|
| 2025 | $6,024 | $730,700 | $198,600 | $532,100 |
| 2023 | $6,024 | $806,100 | $104,400 | $701,700 |
| 2022 | $6,852 | $806,100 | $104,400 | $701,700 |
| 2021 | $6,899 | $806,100 | $104,400 | $701,700 |
| 2020 | $6,484 | $615,500 | $123,600 | $491,900 |
| 2019 | $6,484 | $615,500 | $123,600 | $491,900 |
| 2018 | $6,484 | $615,500 | $123,600 | $491,900 |
| 2017 | $6,484 | $615,500 | $123,600 | $491,900 |
| 2016 | $7,010 | $632,700 | $117,900 | $514,800 |
| 2015 | $6,700 | $632,700 | $117,900 | $514,800 |
| 2014 | $6,416 | $632,700 | $117,900 | $514,800 |
Source: Public Records
Map
Nearby Homes