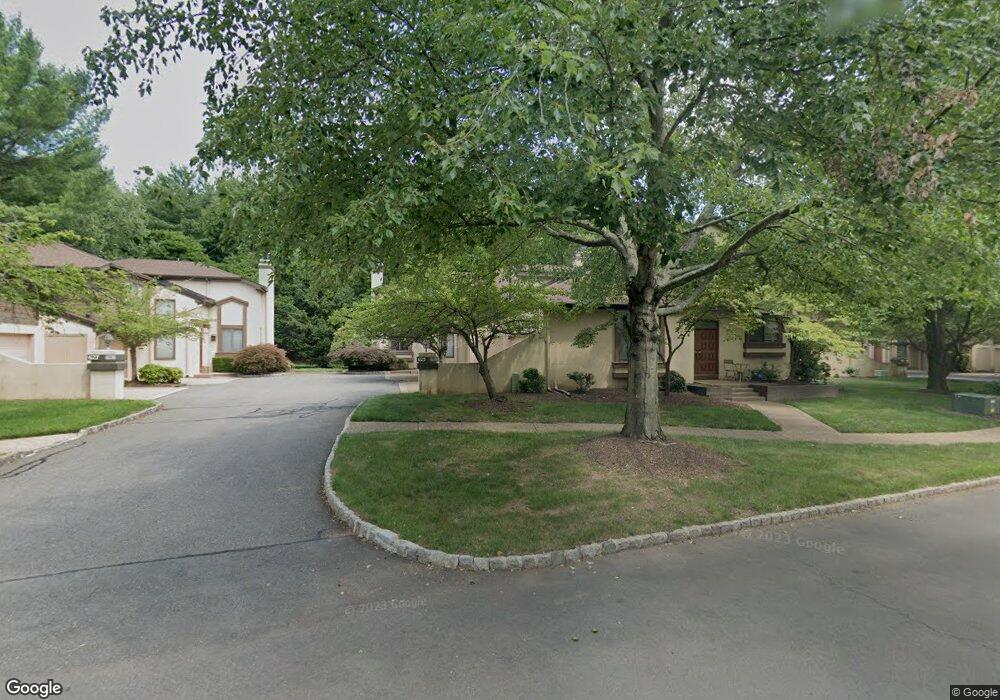
625 Sayre None Princeton, NJ 08540
Estimated Value: $736,000 - $844,000
2
Beds
3
Baths
2,050
Sq Ft
$381/Sq Ft
Est. Value
About This Home
This home is located at 625 Sayre None, Princeton, NJ 08540 and is currently estimated at $780,724, approximately $380 per square foot. 625 Sayre None is a home located in Middlesex County with nearby schools including Town Center Elementary School, Millstone River School, and Thomas R. Grover Middle School.
Ownership History
Date
Name
Owned For
Owner Type
Purchase Details
Closed on
Aug 18, 2015
Sold by
Orenstein Ruth L and Gabriel Anthony R
Bought by
Yuan Jiayi and Yu Xiaohany
Current Estimated Value
Home Financials for this Owner
Home Financials are based on the most recent Mortgage that was taken out on this home.
Original Mortgage
$370,400
Outstanding Balance
$280,720
Interest Rate
3%
Mortgage Type
Adjustable Rate Mortgage/ARM
Estimated Equity
$500,004
Purchase Details
Closed on
Mar 12, 1991
Bought by
Orenstein Ruth
Create a Home Valuation Report for This Property
The Home Valuation Report is an in-depth analysis detailing your home's value as well as a comparison with similar homes in the area
Home Values in the Area
Average Home Value in this Area
Purchase History
| Date | Buyer | Sale Price | Title Company |
|---|---|---|---|
| Yuan Jiayi | -- | Old Republic National Title | |
| Orenstein Ruth | $215,000 | -- |
Source: Public Records
Mortgage History
| Date | Status | Borrower | Loan Amount |
|---|---|---|---|
| Open | Yuan Jiayi | $370,400 |
Source: Public Records
Tax History Compared to Growth
Tax History
| Year | Tax Paid | Tax Assessment Tax Assessment Total Assessment is a certain percentage of the fair market value that is determined by local assessors to be the total taxable value of land and additions on the property. | Land | Improvement |
|---|---|---|---|---|
| 2025 | $12,422 | $475,400 | $125,000 | $350,400 |
| 2024 | $12,123 | $475,400 | $125,000 | $350,400 |
| 2023 | $12,123 | $475,400 | $125,000 | $350,400 |
| 2022 | $11,937 | $475,400 | $125,000 | $350,400 |
| 2021 | $10,848 | $467,700 | $125,000 | $342,700 |
| 2020 | $11,094 | $463,800 | $125,000 | $338,800 |
| 2019 | $10,848 | $463,800 | $125,000 | $338,800 |
| 2018 | $10,607 | $463,800 | $125,000 | $338,800 |
| 2017 | $10,306 | $463,800 | $125,000 | $338,800 |
| 2016 | $9,851 | $463,800 | $125,000 | $338,800 |
| 2015 | $9,940 | $393,800 | $126,000 | $267,800 |
| 2014 | $9,841 | $393,800 | $126,000 | $267,800 |
Source: Public Records
Map
Nearby Homes