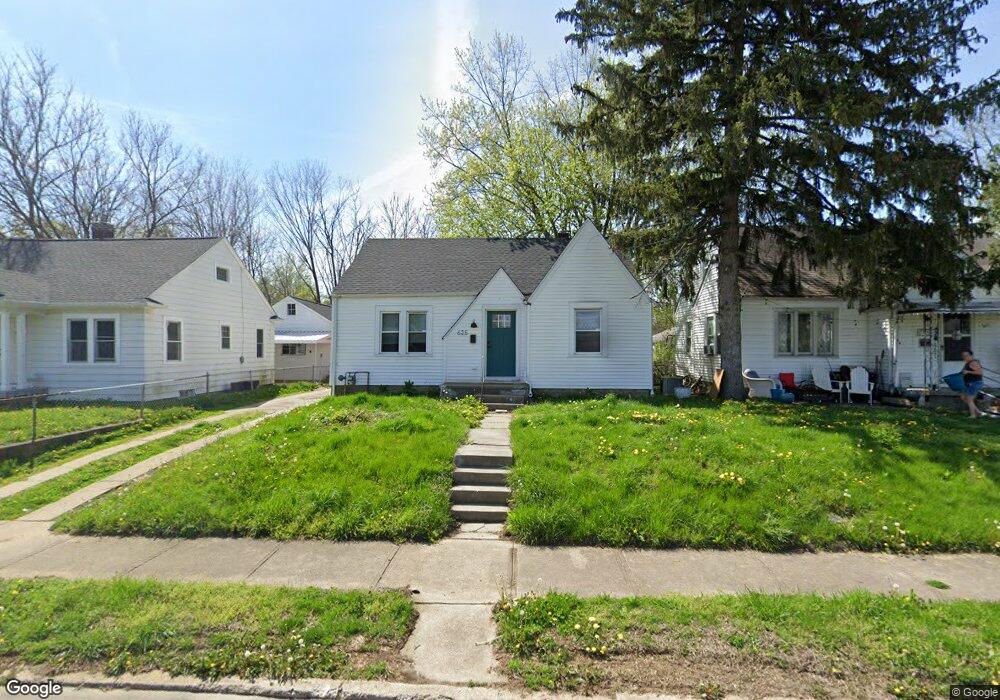
625 Sycamore St Anderson, IN 46016
Estimated Value: $51,000 - $109,000
2
Beds
1
Bath
1,768
Sq Ft
$47/Sq Ft
Est. Value
About This Home
This home is located at 625 Sycamore St, Anderson, IN 46016 and is currently estimated at $82,754, approximately $46 per square foot. 625 Sycamore St is a home located in Madison County with nearby schools including Eastside Elementary School, Highland Middle School, and Anderson High School.
Ownership History
Date
Name
Owned For
Owner Type
Purchase Details
Closed on
Oct 27, 2017
Sold by
M Jewell Llc
Bought by
Equity
Current Estimated Value
Purchase Details
Closed on
Sep 26, 2013
Sold by
Madison County Auditor
Bought by
M Jewell Llc
Purchase Details
Closed on
Sep 30, 2010
Sold by
Fannie Mae
Bought by
Harbour Portfolio Vi Lp
Purchase Details
Closed on
Jun 11, 2010
Sold by
Owens Phillip G and Bac Home Loans Servicing Lp
Bought by
Fannie Mae and Federal National Mortgage Association
Create a Home Valuation Report for This Property
The Home Valuation Report is an in-depth analysis detailing your home's value as well as a comparison with similar homes in the area
Home Values in the Area
Average Home Value in this Area
Purchase History
| Date | Buyer | Sale Price | Title Company |
|---|---|---|---|
| Equity | $12,000 | -- | |
| Thomas Ira Timothy A | $12,000 | Young'S Title & Abstract | |
| M Jewell Llc | -- | -- | |
| Harbour Portfolio Vi Lp | $4,921 | -- | |
| Fannie Mae | $59,730 | -- |
Source: Public Records
Tax History Compared to Growth
Tax History
| Year | Tax Paid | Tax Assessment Tax Assessment Total Assessment is a certain percentage of the fair market value that is determined by local assessors to be the total taxable value of land and additions on the property. | Land | Improvement |
|---|---|---|---|---|
| 2024 | $1,118 | $50,300 | $6,100 | $44,200 |
| 2023 | $1,036 | $46,200 | $5,800 | $40,400 |
| 2022 | $1,039 | $46,300 | $5,500 | $40,800 |
| 2021 | $914 | $40,500 | $5,400 | $35,100 |
| 2020 | $880 | $38,800 | $5,200 | $33,600 |
| 2019 | $1,306 | $37,900 | $5,200 | $32,700 |
| 2018 | $811 | $35,000 | $5,200 | $29,800 |
| 2017 | $511 | $25,400 | $5,200 | $20,200 |
| 2016 | $511 | $25,400 | $5,200 | $20,200 |
| 2014 | $783 | $39,000 | $5,700 | $33,300 |
| 2013 | $783 | $38,800 | $5,700 | $33,100 |
Source: Public Records
Map
Nearby Homes