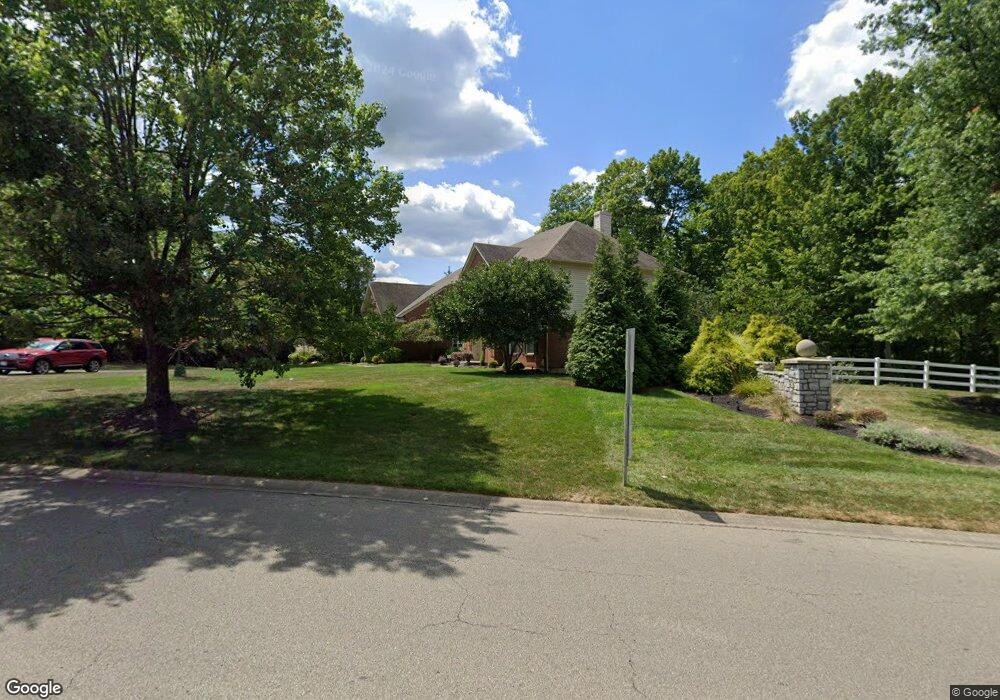
625 Tournament Dr Cincinnati, OH 45244
Estimated Value: $654,000 - $758,000
4
Beds
5
Baths
3,774
Sq Ft
$190/Sq Ft
Est. Value
About This Home
This home is located at 625 Tournament Dr, Cincinnati, OH 45244 and is currently estimated at $718,734, approximately $190 per square foot. 625 Tournament Dr is a home located in Clermont County with nearby schools including Milford Senior High School and St. Veronica Catholic School.
Ownership History
Date
Name
Owned For
Owner Type
Purchase Details
Closed on
Oct 26, 2019
Sold by
Ruotolo Victoria R and Ruotolo Revocable T Victoria R
Bought by
Ruotolo Nicholas A and Ruotolo Victoria R
Current Estimated Value
Purchase Details
Closed on
Sep 23, 2019
Sold by
Ruotolo Victoria R and Ruotolo Revocable T Victoria R
Bought by
Ruotolo Nicholas A and Ruotolo Victoria R
Purchase Details
Closed on
Nov 1, 2008
Sold by
Ruotolo Nicholas A and Ruotolo Victoria R
Bought by
Ruotolo Victoria R and Ruotolo Revocable T Victoria R
Purchase Details
Closed on
Aug 19, 1997
Sold by
Zaring Homes Inc
Bought by
Ruotolo Nicholas A and Ruotolo Victoria R
Home Financials for this Owner
Home Financials are based on the most recent Mortgage that was taken out on this home.
Original Mortgage
$238,850
Outstanding Balance
$32,964
Interest Rate
6.63%
Mortgage Type
New Conventional
Estimated Equity
$685,770
Create a Home Valuation Report for This Property
The Home Valuation Report is an in-depth analysis detailing your home's value as well as a comparison with similar homes in the area
Home Values in the Area
Average Home Value in this Area
Purchase History
| Date | Buyer | Sale Price | Title Company |
|---|---|---|---|
| Ruotolo Nicholas A | -- | None Available | |
| Ruotolo Nicholas A | -- | None Available | |
| Ruotolo Victoria R | -- | Attorney | |
| Ruotolo Nicholas A | $292,052 | -- |
Source: Public Records
Mortgage History
| Date | Status | Borrower | Loan Amount |
|---|---|---|---|
| Open | Ruotolo Nicholas A | $238,850 |
Source: Public Records
Tax History Compared to Growth
Tax History
| Year | Tax Paid | Tax Assessment Tax Assessment Total Assessment is a certain percentage of the fair market value that is determined by local assessors to be the total taxable value of land and additions on the property. | Land | Improvement |
|---|---|---|---|---|
| 2024 | $8,852 | $203,990 | $27,410 | $176,580 |
| 2023 | $8,970 | $203,990 | $27,410 | $176,580 |
| 2022 | $7,680 | $135,460 | $19,780 | $115,680 |
| 2021 | $7,687 | $135,460 | $19,780 | $115,680 |
| 2020 | $8,046 | $147,150 | $19,780 | $127,370 |
| 2019 | $7,043 | $130,030 | $19,670 | $110,360 |
| 2018 | $7,047 | $130,030 | $19,670 | $110,360 |
| 2017 | $7,547 | $130,030 | $19,670 | $110,360 |
| 2016 | $7,547 | $125,230 | $16,800 | $108,430 |
| 2015 | $7,311 | $125,230 | $16,800 | $108,430 |
| 2014 | $7,311 | $125,230 | $16,800 | $108,430 |
| 2013 | $7,842 | $121,770 | $16,800 | $104,970 |
Source: Public Records
Map
Nearby Homes
- 654 Tournament Dr
- 5049 Goal Post Ln
- 5151 Beechwood Rd
- 5183 Miami Hills Dr
- 702 Lake View Dr
- 685 Lake View Dr
- 523 Lang Rd
- 645 Brandy Way
- 4861 Salty Ln
- 631 Charwood Dr
- 557 Williamsburg Ct
- 484 Wesley Dr
- 4885 Beechwood Rd
- 4787 Timberknoll Rd
- 4778 Shadowood Ct
- 3975 Mount Carmel Rd
- 481 Big Moe Dr
- 219 Laurel Ave
- 4723 Brookfield Ct
- 860 Blackcomb Dr
- 627 Tournament Dr
- 629 Tournament Dr
- 5087 Palermo Rd
- 626 Tournament Dr
- 5083 Palermo Rd
- 634 Tournament Dr
- 5079 Palermo Rd
- 5091 Beechwood Rd
- 5099 Palermo Rd
- 5095 Beechwood Rd
- 5103 Palermo Rd
- 5075 Palermo Rd
- 5088 Palermo Rd
- 5094 Palermo Rd
- 5084 Palermo Rd
- 5098 Palermo Rd
- 5080 Palermo Rd
- 5102 Palermo Rd
- 5106 Palermo Rd
- 5135 Beechwood Rd