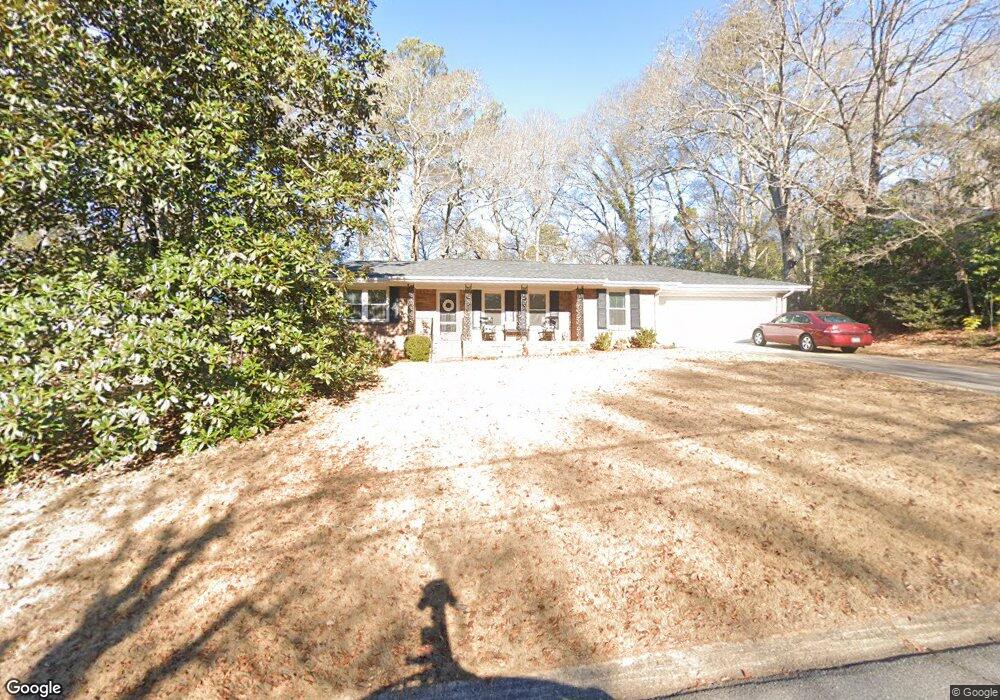
625 University Cir Athens, GA 30605
Estimated Value: $315,000 - $340,000
3
Beds
2
Baths
1,745
Sq Ft
$187/Sq Ft
Est. Value
About This Home
This home is located at 625 University Cir, Athens, GA 30605 and is currently estimated at $326,224, approximately $186 per square foot. 625 University Cir is a home located in Clarke County with nearby schools including Barnett Shoals Elementary School, Hilsman Middle School, and Cedar Shoals High School.
Ownership History
Date
Name
Owned For
Owner Type
Purchase Details
Closed on
Mar 2, 2007
Sold by
Not Provided
Bought by
Elliott Jessica L
Current Estimated Value
Home Financials for this Owner
Home Financials are based on the most recent Mortgage that was taken out on this home.
Original Mortgage
$95,200
Outstanding Balance
$57,176
Interest Rate
6.3%
Mortgage Type
New Conventional
Estimated Equity
$269,048
Purchase Details
Closed on
Dec 21, 2004
Sold by
Mottola James Van S
Bought by
Mottola Katie C
Purchase Details
Closed on
Feb 26, 2001
Sold by
Nzengung Valentine A and Nzengung Florenc
Bought by
Mottola James Van S
Purchase Details
Closed on
Jun 21, 1996
Sold by
Brown Jerry L and Brown Brown
Bought by
Nzengung Valentine A and Nzengung Florence N
Purchase Details
Closed on
Jul 14, 1995
Sold by
Ferguson Bruce C
Bought by
Brown Jerry L and Brown Brown
Create a Home Valuation Report for This Property
The Home Valuation Report is an in-depth analysis detailing your home's value as well as a comparison with similar homes in the area
Home Values in the Area
Average Home Value in this Area
Purchase History
| Date | Buyer | Sale Price | Title Company |
|---|---|---|---|
| Elliott Jessica L | $119,000 | -- | |
| Mottola Katie C | -- | -- | |
| Mottola Katie Colvin | -- | -- | |
| Mottola James Van S | $119,000 | -- | |
| Nzengung Valentine A | $88,900 | -- | |
| Brown Jerry L | $80,000 | -- |
Source: Public Records
Mortgage History
| Date | Status | Borrower | Loan Amount |
|---|---|---|---|
| Open | Elliott Jessica L | $95,200 |
Source: Public Records
Tax History Compared to Growth
Tax History
| Year | Tax Paid | Tax Assessment Tax Assessment Total Assessment is a certain percentage of the fair market value that is determined by local assessors to be the total taxable value of land and additions on the property. | Land | Improvement |
|---|---|---|---|---|
| 2025 | $3,123 | $120,270 | $12,000 | $108,270 |
| 2024 | $3,123 | $110,689 | $12,000 | $98,689 |
| 2023 | $2,109 | $102,498 | $12,000 | $90,498 |
| 2022 | $2,498 | $88,317 | $12,000 | $76,317 |
| 2021 | $2,066 | $71,306 | $12,000 | $59,306 |
| 2020 | $1,896 | $66,256 | $12,000 | $54,256 |
| 2019 | $1,790 | $62,711 | $12,000 | $50,711 |
| 2018 | $1,695 | $59,936 | $12,000 | $47,936 |
| 2017 | $1,440 | $52,425 | $12,000 | $40,425 |
| 2016 | $1,454 | $52,816 | $12,000 | $40,816 |
| 2015 | $1,441 | $52,366 | $12,000 | $40,366 |
| 2014 | $1,481 | $53,458 | $12,000 | $41,458 |
Source: Public Records
Map
Nearby Homes
- 645 University Cir
- 615 University Cir
- 533 University Cir
- 527 University Cir
- 651 University Cir
- 620 University Cir
- 610 University Cir
- 600 University Cir
- 630 University Cir
- 521 University Cir
- 640 University Cir
- 665 University Cir
- 515 University Cir
- 522 University Cir
- 650 University Cir
- 675 University Cir
- 510 University Cir
- 509 University Cir
- 660 University Cir
- 510 Caldwell Cir