Estimated Value: $244,000 - $274,000
3
Beds
2
Baths
1,535
Sq Ft
$165/Sq Ft
Est. Value
About This Home
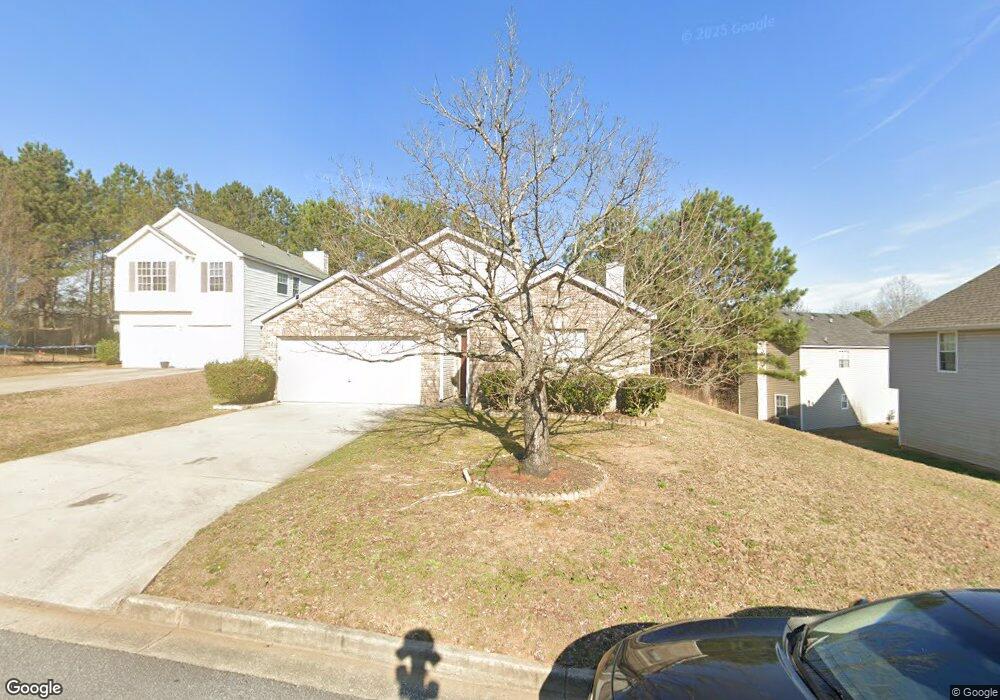
This home is located at 6250 Crooked Creek Ct Unit O, Rex, GA 30273 and is currently estimated at $253,899, approximately $165 per square foot. 6250 Crooked Creek Ct Unit O is a home located in Clayton County with nearby schools including Roberta T. Smith Elementary School, Rex Mill Middle School, and Morrow High School.
Ownership History
Date
Name
Owned For
Owner Type
Purchase Details
Closed on
Apr 22, 2021
Sold by
Opendoor Property Trust I
Bought by
Sfr Jv 1 Property Llc
Current Estimated Value
Purchase Details
Closed on
Mar 31, 2021
Sold by
Crossland Byron A
Bought by
Opendoor Property Trust I
Purchase Details
Closed on
Aug 19, 2019
Sold by
Real Estate Investments By Jbc Llc
Bought by
Crossland Byron A and Crossland Johnnie M
Purchase Details
Closed on
Dec 29, 2010
Sold by
Crossland Byron A and Crossland Johnnie M
Bought by
Real Estate Invs Of Jbc Llc
Purchase Details
Closed on
Aug 30, 2010
Sold by
Kukoyi Benedictus
Bought by
Crossland Byron A and Crossland Johnnie M
Home Financials for this Owner
Home Financials are based on the most recent Mortgage that was taken out on this home.
Original Mortgage
$43,500
Interest Rate
4.59%
Mortgage Type
New Conventional
Create a Home Valuation Report for This Property
The Home Valuation Report is an in-depth analysis detailing your home's value as well as a comparison with similar homes in the area
Home Values in the Area
Average Home Value in this Area
Purchase History
| Date | Buyer | Sale Price | Title Company |
|---|---|---|---|
| Sfr Jv 1 Property Llc | $185,000 | -- | |
| Opendoor Property Trust I | $178,100 | -- | |
| Crossland Byron A | -- | -- | |
| Real Estate Invs Of Jbc Llc | -- | -- | |
| Crossland Byron A | $58,000 | -- |
Source: Public Records
Mortgage History
| Date | Status | Borrower | Loan Amount |
|---|---|---|---|
| Previous Owner | Crossland Byron A | $43,500 |
Source: Public Records
Tax History Compared to Growth
Tax History
| Year | Tax Paid | Tax Assessment Tax Assessment Total Assessment is a certain percentage of the fair market value that is determined by local assessors to be the total taxable value of land and additions on the property. | Land | Improvement |
|---|---|---|---|---|
| 2024 | $4,111 | $104,400 | $7,200 | $97,200 |
| 2023 | $3,807 | $104,400 | $7,200 | $97,200 |
| 2022 | $2,942 | $74,000 | $6,640 | $67,360 |
| 2021 | $2,264 | $56,360 | $7,200 | $49,160 |
| 2020 | $2,208 | $54,265 | $7,200 | $47,065 |
| 2019 | $2,082 | $50,352 | $6,400 | $43,952 |
| 2018 | $1,913 | $46,196 | $6,400 | $39,796 |
| 2017 | $1,623 | $38,953 | $6,400 | $32,553 |
| 2016 | $1,396 | $33,372 | $6,400 | $26,972 |
| 2015 | $1,215 | $0 | $0 | $0 |
| 2014 | $964 | $23,278 | $8,000 | $15,278 |
Source: Public Records
Map
Nearby Homes
- 6010 Crooked Creek Dr
- 3645 Fay Dr Unit 1
- 6247 Ellenwood Dr
- 3571 Rock Ridge Dr
- 6257 Ellenwood Dr
- 6139 Katherine Rd
- 6103 Chaseland Rd
- 6103 Chaseland Dr
- 6294 Ellenwood Dr
- 6683 Homestead Rd
- 6154 Lauren Ln Unit 1
- 6285 Ellenwood Dr
- 6324 Amberly Rd
- 6057 Dorchester Dr
- 6347 Ellenwood Dr Unit 2
- 6345 Ellenwood Dr
- 3709 Charlotte Dr
- 6061 Tina Ln
- 6435 Cumberland Dr
- 6250 Crooked Creek Ct
- 6244 Crooked Creek Ct
- 6219 Crooked Creek Dr
- 6205 Crooked Creek Dr
- 6191 Crooked Creek Dr
- 6238 Crooked Creek Ct
- 6251 Crooked Creek Ct
- 6231 Crooked Creek Dr
- 6245 Crooked Creek Ct
- 6173 Crooked Creek Dr
- 6234 Crooked Creek Ct
- 6159 Crooked Creek Dr
- 6239 Crooked Creek Ct
- 6237 Crooked Creek Dr
- 6149 Crooked Creek Dr
- 6235 Crooked Creek Ct
- 6216 Crooked Creek Dr Unit 6216
- 6216 Crooked Creek Dr
- 6210 Crooked Creek Dr