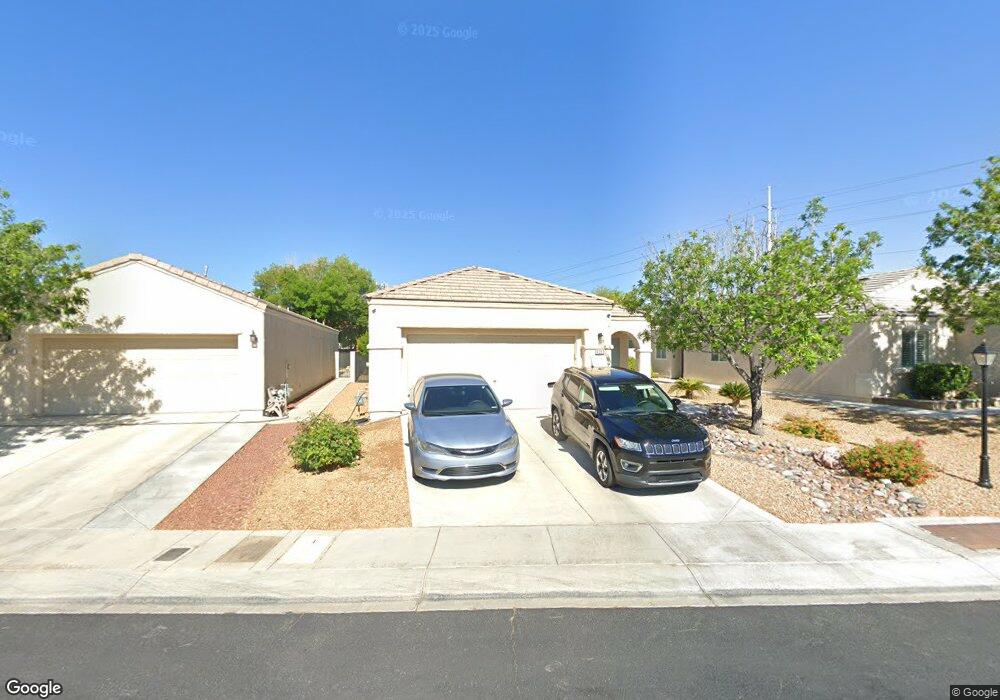
6253 Eagle Crossing St Las Vegas, NV 89130
North Cheyenne NeighborhoodEstimated Value: $381,000 - $402,000
3
Beds
2
Baths
1,423
Sq Ft
$275/Sq Ft
Est. Value
About This Home
This home is located at 6253 Eagle Crossing St, Las Vegas, NV 89130 and is currently estimated at $392,019, approximately $275 per square foot. 6253 Eagle Crossing St is a home located in Clark County with nearby schools including Kay Carl Elementary School, Anthony Saville Middle School, and Shadow Ridge High School.
Ownership History
Date
Name
Owned For
Owner Type
Purchase Details
Closed on
Aug 20, 2015
Sold by
Callejo Christopher A and Fusell Ashley
Bought by
Callejo Christopher A and Fussell Ashley
Current Estimated Value
Purchase Details
Closed on
Jan 20, 2012
Sold by
Coppens Gary L
Bought by
Coppens Janet
Purchase Details
Closed on
Nov 8, 2011
Sold by
Dyer Juliana and Dyer Adam
Bought by
Callejo Christopher A and Coppens Janet
Home Financials for this Owner
Home Financials are based on the most recent Mortgage that was taken out on this home.
Original Mortgage
$82,845
Interest Rate
4.4%
Mortgage Type
FHA
Purchase Details
Closed on
Dec 27, 2004
Sold by
Thurgood Steven J and Thurgood Holly H
Bought by
Galusha Juliana L
Home Financials for this Owner
Home Financials are based on the most recent Mortgage that was taken out on this home.
Original Mortgage
$215,900
Interest Rate
5.62%
Mortgage Type
New Conventional
Purchase Details
Closed on
Sep 26, 2002
Sold by
Pn Ii Inc
Bought by
Thurgood Steven J and Thurgood Holly H
Home Financials for this Owner
Home Financials are based on the most recent Mortgage that was taken out on this home.
Original Mortgage
$152,961
Interest Rate
6.16%
Create a Home Valuation Report for This Property
The Home Valuation Report is an in-depth analysis detailing your home's value as well as a comparison with similar homes in the area
Home Values in the Area
Average Home Value in this Area
Purchase History
| Date | Buyer | Sale Price | Title Company |
|---|---|---|---|
| Callejo Christopher A | $173,643 | Servicelink Aliquippa Title | |
| Coppens Janet | -- | Noble Title | |
| Callejo Christopher A | $85,000 | Noble Title | |
| Galusha Juliana L | $269,900 | Equity Title Of Nevada | |
| Thurgood Steven J | $157,692 | Lawyers Title |
Source: Public Records
Mortgage History
| Date | Status | Borrower | Loan Amount |
|---|---|---|---|
| Previous Owner | Callejo Christopher A | $82,845 | |
| Previous Owner | Galusha Juliana L | $215,900 | |
| Previous Owner | Thurgood Steven J | $152,961 | |
| Closed | Galusha Juliana L | $40,500 |
Source: Public Records
Tax History Compared to Growth
Tax History
| Year | Tax Paid | Tax Assessment Tax Assessment Total Assessment is a certain percentage of the fair market value that is determined by local assessors to be the total taxable value of land and additions on the property. | Land | Improvement |
|---|---|---|---|---|
| 2025 | $1,456 | $96,268 | $32,550 | $63,718 |
| 2024 | $1,414 | $96,268 | $32,550 | $63,718 |
| 2023 | $1,414 | $89,966 | $29,750 | $60,216 |
| 2022 | $1,373 | $79,046 | $24,150 | $54,896 |
| 2021 | $1,333 | $75,659 | $23,450 | $52,209 |
| 2020 | $1,291 | $74,866 | $23,100 | $51,766 |
| 2019 | $1,275 | $68,473 | $17,500 | $50,973 |
| 2018 | $1,217 | $64,036 | $15,050 | $48,986 |
| 2017 | $1,992 | $60,775 | $11,200 | $49,575 |
| 2016 | $1,140 | $50,037 | $9,450 | $40,587 |
| 2015 | $1,137 | $39,644 | $8,400 | $31,244 |
| 2014 | $1,101 | $33,761 | $5,250 | $28,511 |
Source: Public Records
Map
Nearby Homes
- 0 Leon Ave Unit 2629017
- 5840 McLennan Ranch Ave
- 5424 Eagle Claw Ave
- 6101 Crystal Talon St
- 6132 Peggotty Ave
- 6128 Rabbit Track St
- 6112 Rabbit Track St
- 5808 Spinnaker Reach Ave
- 6141 Markleham Ave
- 5501 Wells Cathedral Ave
- 6116 Cottontail Cove St
- 5305 Meadow Rock Ave
- 6614 Collingsworth St
- 6124 Arwells Corner Ct
- 6324 Whispering Meadow Ct
- 6489 Yellow Bells Ct
- 6493 Yellow Bells Ct
- 5832 Farnsworth Pond Ave
- 6245 Hawthorn Woods Ave
- 6227 Orto Vaso Ave
- 6257 Eagle Crossing St
- 6249 Eagle Crossing St
- 6261 Eagle Crossing St
- 6261 Eagle Crossing St
- 6245 Eagle Crossing St
- 6241 Eagle Crossing St
- 6265 Eagle Crossing St
- 5712 Eagle Claw Ave
- 6237 Eagle Crossing St
- 6244 Eagle Crossing St
- 5708 Eagle Claw Ave
- 6240 Eagle Crossing St
- 6233 Eagle Crossing St
- 6260 Eagle Crossing St
- 5704 Eagle Claw Ave
- 6236 Eagle Crossing St
- 6264 Eagle Crossing St
- 5705 Eagle Claw Ave
- 6229 Eagle Crossing St
- 5700 Eagle Claw Ave