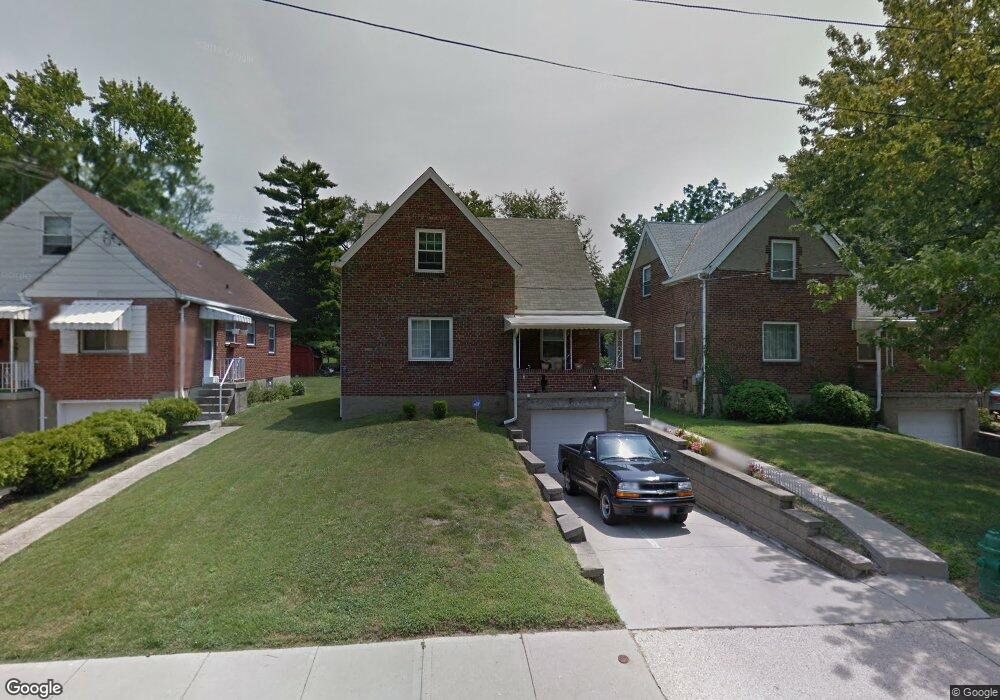
6254 Mayflower Ave Cincinnati, OH 45237
Estimated Value: $194,805 - $249,000
3
Beds
1
Bath
1,539
Sq Ft
$144/Sq Ft
Est. Value
About This Home
This home is located at 6254 Mayflower Ave, Cincinnati, OH 45237 and is currently estimated at $220,951, approximately $143 per square foot. 6254 Mayflower Ave is a home located in Hamilton County with nearby schools including Pleasant Ridge Montessori School, Shroder High School, and Clark Montessori High School.
Ownership History
Date
Name
Owned For
Owner Type
Purchase Details
Closed on
Jun 28, 2011
Sold by
Fannie Mae
Bought by
Zerhusen Brad
Current Estimated Value
Purchase Details
Closed on
Dec 16, 2010
Sold by
Williams Otis
Bought by
Federal National Mortgage Association
Purchase Details
Closed on
Dec 19, 2001
Sold by
Murphy Ronald and Murphy Beverly J
Bought by
Brewster Willie H and Lowe Joe Ann
Home Financials for this Owner
Home Financials are based on the most recent Mortgage that was taken out on this home.
Original Mortgage
$97,947
Interest Rate
6.53%
Mortgage Type
FHA
Purchase Details
Closed on
Oct 20, 1999
Sold by
Monroe Beverly J and Murphy Beverly J
Bought by
Murphy Ronald
Create a Home Valuation Report for This Property
The Home Valuation Report is an in-depth analysis detailing your home's value as well as a comparison with similar homes in the area
Home Values in the Area
Average Home Value in this Area
Purchase History
| Date | Buyer | Sale Price | Title Company |
|---|---|---|---|
| Zerhusen Brad | $42,000 | None Available | |
| Federal National Mortgage Association | $56,000 | None Available | |
| Brewster Willie H | $99,500 | Vintage Title Agency Inc | |
| Murphy Ronald | -- | -- |
Source: Public Records
Mortgage History
| Date | Status | Borrower | Loan Amount |
|---|---|---|---|
| Previous Owner | Brewster Willie H | $97,947 |
Source: Public Records
Tax History
| Year | Tax Paid | Tax Assessment Tax Assessment Total Assessment is a certain percentage of the fair market value that is determined by local assessors to be the total taxable value of land and additions on the property. | Land | Improvement |
|---|---|---|---|---|
| 2025 | $3,356 | $46,862 | $8,645 | $38,217 |
| 2023 | $3,330 | $46,862 | $8,645 | $38,217 |
| 2022 | $2,514 | $27,671 | $5,579 | $22,092 |
| 2021 | $2,435 | $27,671 | $5,579 | $22,092 |
| 2020 | $2,481 | $27,671 | $5,579 | $22,092 |
| 2019 | $2,485 | $24,490 | $4,939 | $19,551 |
| 2018 | $2,440 | $24,490 | $4,939 | $19,551 |
| 2017 | $2,371 | $24,490 | $4,939 | $19,551 |
| 2016 | $2,935 | $30,016 | $5,488 | $24,528 |
| 2015 | $2,733 | $30,016 | $5,488 | $24,528 |
| 2014 | $2,597 | $30,016 | $5,488 | $24,528 |
| 2013 | $2,623 | $30,016 | $5,488 | $24,528 |
Source: Public Records
Map
Nearby Homes
- 6251 Elbrook Ave
- 6202 Mayflower Ave
- 6025 Mayflower Ave
- 2410 Langdon Farm Rd
- 2327 Losantiville Ave
- 2344 Losantiville Ave
- 2526 Bremont Ave
- 2063 E Seymour Ave
- 2537 Vera Ave
- 2539 Vera Ave
- 2541 Vera Ave
- 2543 Vera Ave
- 6750 Elbrook Ave
- 6770 Elbrook Ave
- 2210 Varelman Ave
- 2206 Varelman Ave
- 5721 Carthage Ave
- 2758 Losantiridge Ave
- 5620 Pemberton Ave
- 1849 Greenbriar Place
- 6258 Mayflower Ave
- 6250 Mayflower Ave
- 6246 Mayflower Ave
- 6262 Mayflower Ave
- 6242 Mayflower Ave
- 6266 Mayflower Ave
- 6238 Mayflower Ave
- 6270 Mayflower Ave
- 6253 Mayflower Ave
- 6259 Mayflower Ave
- 6247 Mayflower Ave
- 6255 Graceland Ave
- 6251 Graceland Ave
- 6234 Mayflower Ave
- 6243 Mayflower Ave
- 6247 Graceland Ave
- 6274 Mayflower Ave
- 6243 Graceland Ave
- 6259 Graceland Ave
- 6267 Graceland Ave