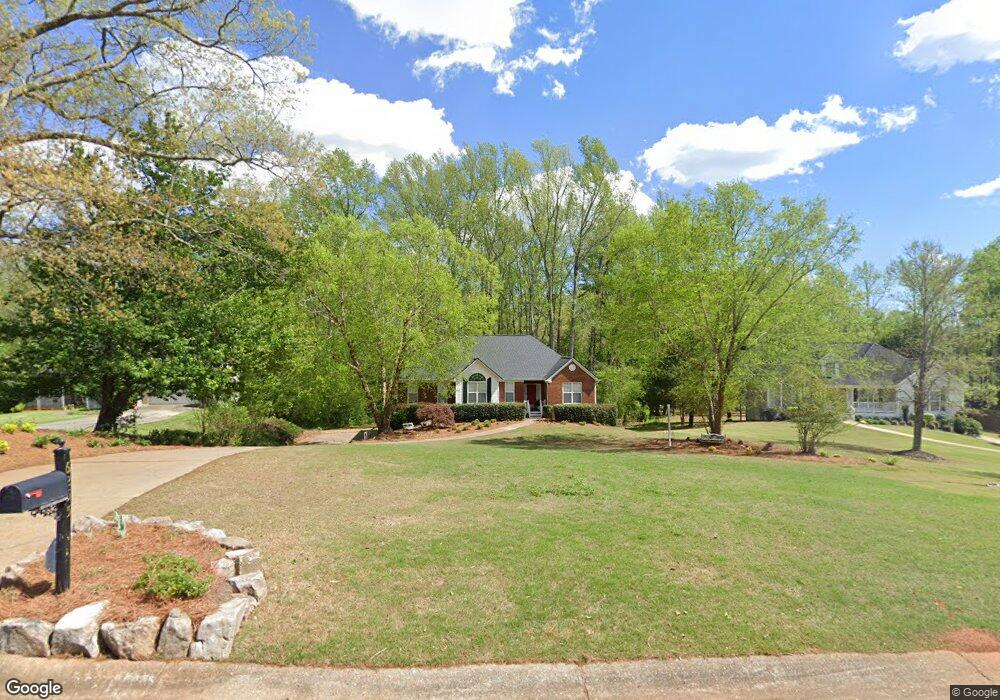
6255 Dexters Dr Cumming, GA 30040
Estimated Value: $469,793 - $523,000
1
Bed
1
Bath
800
Sq Ft
$621/Sq Ft
Est. Value
About This Home
This home is located at 6255 Dexters Dr, Cumming, GA 30040 and is currently estimated at $496,448, approximately $620 per square foot. 6255 Dexters Dr is a home located in Forsyth County with nearby schools including Coal Mountain Elementary School, North Forsyth Middle School, and North Forsyth High School.
Ownership History
Date
Name
Owned For
Owner Type
Purchase Details
Closed on
Feb 15, 2008
Sold by
Citimortgage Inc
Bought by
Pinkerton Patricia G
Current Estimated Value
Home Financials for this Owner
Home Financials are based on the most recent Mortgage that was taken out on this home.
Original Mortgage
$207,000
Outstanding Balance
$127,743
Interest Rate
5.65%
Mortgage Type
New Conventional
Estimated Equity
$368,705
Purchase Details
Closed on
Sep 6, 2007
Sold by
Citimortgage Inc
Bought by
Kemp Jeffrey A and Kemp Melissa A
Purchase Details
Closed on
Aug 15, 2001
Sold by
Hendrix Place Construction Inc
Bought by
Kemp Jeffrey A and Kemp Melissa A
Home Financials for this Owner
Home Financials are based on the most recent Mortgage that was taken out on this home.
Original Mortgage
$181,250
Interest Rate
7.18%
Mortgage Type
New Conventional
Create a Home Valuation Report for This Property
The Home Valuation Report is an in-depth analysis detailing your home's value as well as a comparison with similar homes in the area
Home Values in the Area
Average Home Value in this Area
Purchase History
| Date | Buyer | Sale Price | Title Company |
|---|---|---|---|
| Pinkerton Patricia G | $230,000 | -- | |
| Kemp Jeffrey A | $241,000 | -- | |
| Kemp Jeffrey A | $190,800 | -- | |
| Hendrix Place Construction | $45,000 | -- |
Source: Public Records
Mortgage History
| Date | Status | Borrower | Loan Amount |
|---|---|---|---|
| Open | Pinkerton Patricia G | $207,000 | |
| Previous Owner | Hendrix Place Construction | $181,250 |
Source: Public Records
Tax History Compared to Growth
Tax History
| Year | Tax Paid | Tax Assessment Tax Assessment Total Assessment is a certain percentage of the fair market value that is determined by local assessors to be the total taxable value of land and additions on the property. | Land | Improvement |
|---|---|---|---|---|
| 2025 | $616 | $200,412 | $60,000 | $140,412 |
| 2024 | $616 | $172,640 | $40,000 | $132,640 |
| 2023 | $506 | $152,776 | $30,000 | $122,776 |
| 2022 | $620 | $110,384 | $24,000 | $86,384 |
| 2021 | $592 | $110,384 | $24,000 | $86,384 |
| 2020 | $589 | $106,704 | $24,000 | $82,704 |
| 2019 | $588 | $101,188 | $20,000 | $81,188 |
| 2018 | $575 | $83,468 | $16,000 | $67,468 |
| 2017 | $579 | $80,280 | $16,000 | $64,280 |
| 2016 | $576 | $78,280 | $14,000 | $64,280 |
| 2015 | $2,089 | $78,280 | $14,000 | $64,280 |
| 2014 | $1,789 | $70,848 | $0 | $0 |
Source: Public Records
Map
Nearby Homes
- 6230 Dana Way
- 6445 Crystal Ln
- 7005 Walnut Mill Landing
- 3940 Twin Lakes Rd
- 4420 Belcrest Way
- 4905 Rosarian Dr
- 4855 Rosarian Dr
- 4115 Sierra Vista Cir
- 4710 Rosarian Dr
- 4095 Sierra Vista Cir
- 7620 Ivy Grove St
- 7480 Ivy Grove St
- 5925 Water Mark Dr
- 6040 Boulder Bluff Dr
- 4555 Dennington Trace
- 4015 Sierra Vista Cir
- 3810 Sierra Lake Dr
- 6245 Dexters Dr
- 6265 Dexters Dr
- 6235 Dexters Dr
- 6260 Dexters Dr
- 6240 Dexters Dr
- 6285 Dexters Dr
- 6290 Dexters Dr
- 6225 Dexters Dr
- 6245 Dana Way
- 4530 Melissa Ln
- 6295 Dexters Dr
- 6310 Dexters Dr
- 6225 Dana Way
- 6255 Dana Way
- 4520 Melissa Ln
- 6215 Dexters Dr
- 0 Dana Way
- 6315 Dexters Dr
- 6320 Dexters Dr
- 6205 Dexters Dr