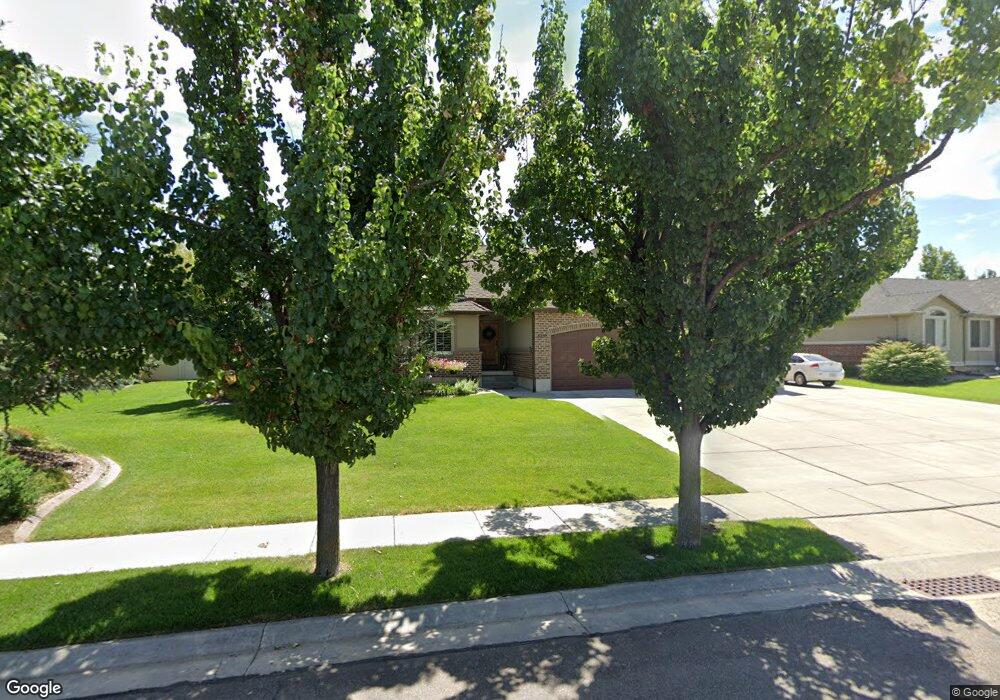
6255 W 5300 S Hooper, UT 84315
Estimated Value: $665,000 - $716,000
--
Bed
3
Baths
1,856
Sq Ft
$372/Sq Ft
Est. Value
About This Home
This home is located at 6255 W 5300 S, Hooper, UT 84315 and is currently estimated at $690,799, approximately $372 per square foot. 6255 W 5300 S is a home located in Weber County with nearby schools including Hooper Elementary School, Rocky Mountain Junior High School, and Quest Academy.
Ownership History
Date
Name
Owned For
Owner Type
Purchase Details
Closed on
Oct 4, 2017
Sold by
Christensen Kimberly D and Christensen Matthew A
Bought by
Christensen Matthew A and Christensen Kimberly D
Current Estimated Value
Purchase Details
Closed on
Mar 2, 2007
Sold by
Cliff Bell Construction Inc
Bought by
Christensen Matthew A and Christensen Kimberly D
Home Financials for this Owner
Home Financials are based on the most recent Mortgage that was taken out on this home.
Original Mortgage
$210,000
Outstanding Balance
$127,319
Interest Rate
6.29%
Mortgage Type
Purchase Money Mortgage
Estimated Equity
$563,480
Purchase Details
Closed on
Jan 25, 2006
Sold by
Lakeview Farms 1 Llc
Bought by
Cliff Bell Construction Inc
Create a Home Valuation Report for This Property
The Home Valuation Report is an in-depth analysis detailing your home's value as well as a comparison with similar homes in the area
Home Values in the Area
Average Home Value in this Area
Purchase History
| Date | Buyer | Sale Price | Title Company |
|---|---|---|---|
| Christensen Matthew A | -- | None Available | |
| Christensen Matthew A | -- | First American Title Fashio | |
| Cliff Bell Construction Inc | -- | Mountain View Title Ogden |
Source: Public Records
Mortgage History
| Date | Status | Borrower | Loan Amount |
|---|---|---|---|
| Open | Christensen Matthew A | $210,000 |
Source: Public Records
Tax History Compared to Growth
Tax History
| Year | Tax Paid | Tax Assessment Tax Assessment Total Assessment is a certain percentage of the fair market value that is determined by local assessors to be the total taxable value of land and additions on the property. | Land | Improvement |
|---|---|---|---|---|
| 2025 | $3,906 | $681,290 | $225,007 | $456,283 |
| 2024 | $3,762 | $367,399 | $123,753 | $243,646 |
| 2023 | $3,887 | $376,200 | $123,751 | $252,449 |
| 2022 | $3,650 | $361,350 | $99,001 | $262,349 |
| 2021 | $3,272 | $546,000 | $115,067 | $430,933 |
| 2020 | $3,042 | $465,000 | $100,081 | $364,919 |
| 2019 | $3,003 | $434,000 | $89,926 | $344,074 |
| 2018 | $3,053 | $422,000 | $79,896 | $342,104 |
| 2017 | $2,711 | $363,000 | $79,961 | $283,039 |
| 2016 | $2,213 | $159,976 | $38,114 | $121,862 |
| 2015 | $2,171 | $154,611 | $38,552 | $116,059 |
| 2014 | $2,026 | $140,358 | $38,552 | $101,806 |
Source: Public Records
Map
Nearby Homes
- 6360 W 5500 S
- 0 W 5500 S
- 6036 W 4700 S
- 3729 S 5600 W Unit 6
- 3720 S 5600 W Unit 2
- 3719 S 5600 W Unit 7
- 5335 W 5500 S
- 5752 W 2425 N
- 5801 S 7100 W
- 4129 S 5800 W Unit 4
- 4146 S 5800 W Unit 5
- 4194 S 5800 W Unit 14
- 4168 S 5800 W Unit 12
- 4179 S 5800 W Unit 1
- 4163 S 5800 W Unit 2
- 3632 S 5400 W
- 7396 W 5500 S
- 4879 S 5050 W
- 4836 S 5050 W
- 5577 W 4000 S