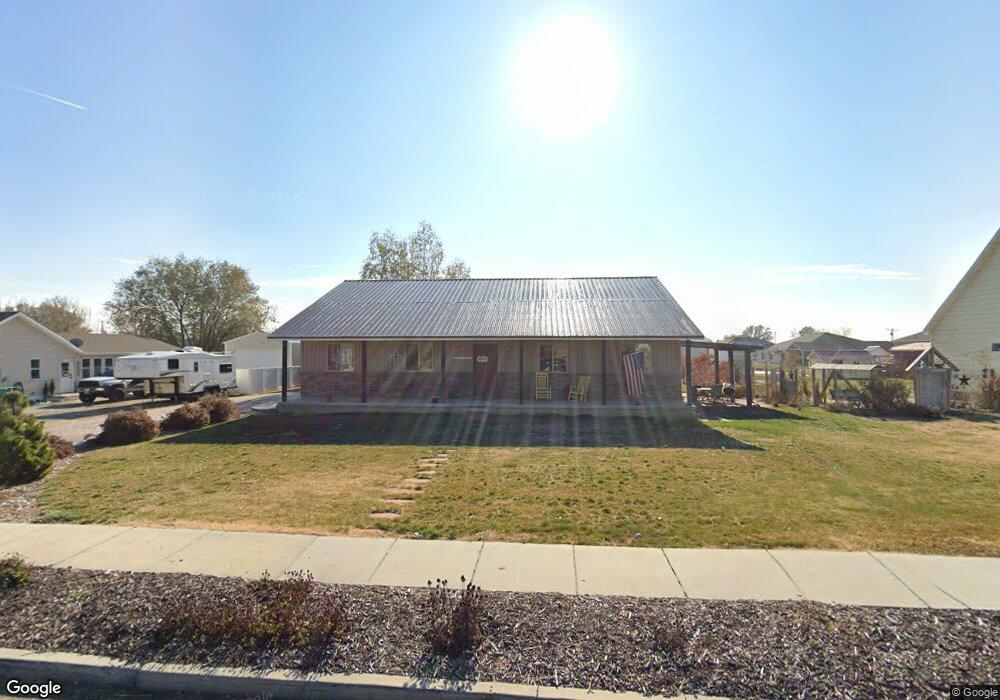
6257 W 5500 S Hooper, UT 84315
Estimated Value: $528,000 - $629,000
3
Beds
1
Bath
1,580
Sq Ft
$365/Sq Ft
Est. Value
About This Home
This home is located at 6257 W 5500 S, Hooper, UT 84315 and is currently estimated at $576,632, approximately $364 per square foot. 6257 W 5500 S is a home located in Weber County with nearby schools including Hooper Elementary School, Rocky Mountain Junior High School, and Quest Academy.
Ownership History
Date
Name
Owned For
Owner Type
Purchase Details
Closed on
Mar 15, 2021
Sold by
Magruder Charles L and Magruder Lily
Bought by
Magruder Charles L and Magruder Lily
Current Estimated Value
Purchase Details
Closed on
May 23, 2013
Sold by
Haws Development Corp
Bought by
Magruder Charles L and Magruder Lily
Purchase Details
Closed on
May 11, 2009
Sold by
Roberts Dennis C and Roberts Nyla
Bought by
Haws Development Corp
Home Financials for this Owner
Home Financials are based on the most recent Mortgage that was taken out on this home.
Original Mortgage
$278,824
Interest Rate
4.8%
Mortgage Type
Seller Take Back
Purchase Details
Closed on
May 4, 2009
Sold by
Haws Development Corp
Bought by
Roberts Dennis C and Roberts Nyla F
Home Financials for this Owner
Home Financials are based on the most recent Mortgage that was taken out on this home.
Original Mortgage
$278,824
Interest Rate
4.8%
Mortgage Type
Seller Take Back
Create a Home Valuation Report for This Property
The Home Valuation Report is an in-depth analysis detailing your home's value as well as a comparison with similar homes in the area
Home Values in the Area
Average Home Value in this Area
Purchase History
| Date | Buyer | Sale Price | Title Company |
|---|---|---|---|
| Magruder Charles L | -- | None Available | |
| Magruder Charles L | -- | Mountain View Title | |
| Haws Development Corp | -- | Mountain View Title Ogden | |
| Roberts Dennis C | -- | Mountain View Title Ogden |
Source: Public Records
Mortgage History
| Date | Status | Borrower | Loan Amount |
|---|---|---|---|
| Previous Owner | Haws Development Corp | $278,824 |
Source: Public Records
Tax History Compared to Growth
Tax History
| Year | Tax Paid | Tax Assessment Tax Assessment Total Assessment is a certain percentage of the fair market value that is determined by local assessors to be the total taxable value of land and additions on the property. | Land | Improvement |
|---|---|---|---|---|
| 2025 | $3,002 | $523,595 | $159,837 | $363,758 |
| 2024 | $2,889 | $282,149 | $87,910 | $194,239 |
| 2023 | $2,796 | $270,600 | $80,244 | $190,356 |
| 2022 | $2,678 | $265,100 | $63,590 | $201,510 |
| 2021 | $2,254 | $376,000 | $86,276 | $289,724 |
| 2020 | $2,178 | $333,000 | $50,309 | $282,691 |
| 2019 | $2,076 | $300,000 | $37,763 | $262,237 |
| 2018 | $1,903 | $263,000 | $32,802 | $230,198 |
| 2017 | $1,800 | $241,000 | $32,789 | $208,211 |
| 2016 | $1,591 | $115,022 | $23,374 | $91,648 |
| 2015 | $1,514 | $107,827 | $20,543 | $87,284 |
| 2014 | $1,466 | $101,604 | $25,039 | $76,565 |
Source: Public Records
Map
Nearby Homes
- 6360 W 5500 S
- 0 W 5500 S
- 6014 W 5300 S
- 6036 W 4700 S
- 5752 W 2425 N
- 5319 S 7100 W
- 5801 S 7100 W
- 5335 W 5500 S
- 3729 S 5600 W Unit 6
- 3720 S 5600 W Unit 2
- 3719 S 5600 W Unit 7
- 3632 S 5400 W
- 4146 S 5800 W Unit 5
- 4163 S 5800 W Unit 2
- 4879 S 5050 W
- 2084 N 4500 W
- 2462 N Hooded Crane Ct
- 2444 N Hooded Crane Cir Unit 11
- 4700 W 5500 S
- 4100 S 5900 W
- 6257 W 5500 S Unit 3
- 6241 W 5500 S
- 6277 W 5500 S
- 6277 W 5500 S Unit 2
- 6225 W 5500 S
- 5510 S 6300 W Unit 1
- 5510 S 6300 W
- 6294 W 5500 S
- 6294 W 5500 S
- 5530 S 6300 W
- 5560 S 6300 W
- 5521 S 6300 W
- 5529 S 6300 W
- 6202 W 5500 S
- 6320 W 5500 S
- 6272 W 5500 S
- 6256 W 5600 S
- 6240 W 5600 S
- 5547 S 6300 W
- 5481 S 6300 W