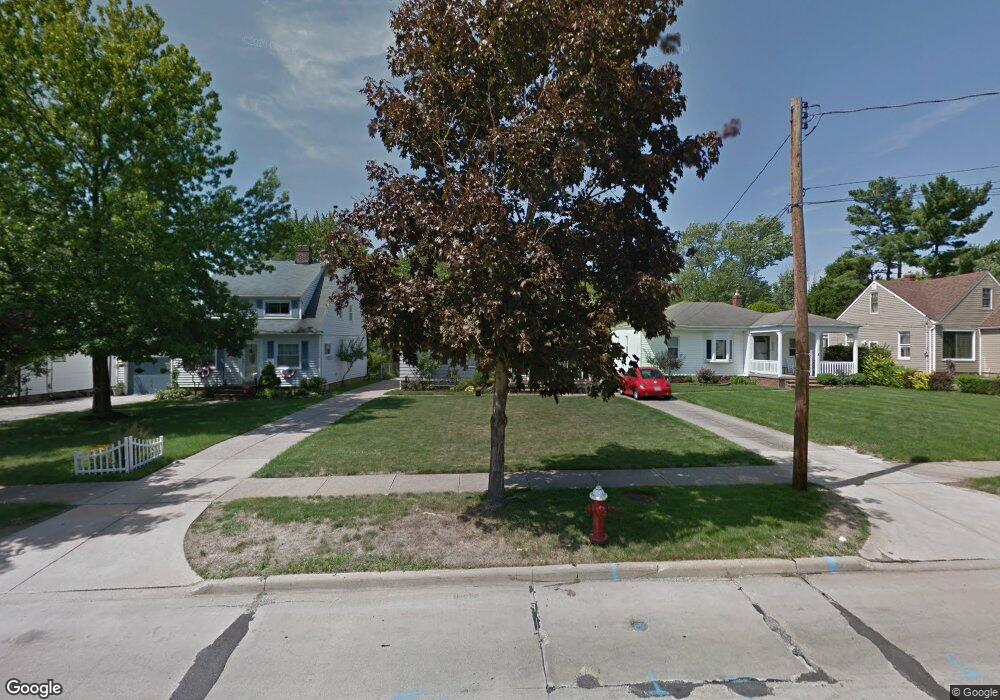
6258 Dunham Rd Maple Heights, OH 44137
Estimated Value: $121,000 - $167,000
3
Beds
1
Bath
1,311
Sq Ft
$112/Sq Ft
Est. Value
About This Home
This home is located at 6258 Dunham Rd, Maple Heights, OH 44137 and is currently estimated at $146,379, approximately $111 per square foot. 6258 Dunham Rd is a home located in Cuyahoga County with nearby schools including Abraham Lincoln Elementary School, Rockside/ J.F. Kennedy School, and Barack Obama School.
Ownership History
Date
Name
Owned For
Owner Type
Purchase Details
Closed on
Apr 22, 2003
Sold by
Burrell Jeffery P and Burrell Eula F
Bought by
Burrell Jeffrey P
Current Estimated Value
Home Financials for this Owner
Home Financials are based on the most recent Mortgage that was taken out on this home.
Original Mortgage
$89,380
Interest Rate
5.4%
Mortgage Type
FHA
Purchase Details
Closed on
Sep 29, 1995
Sold by
Chiabai Valentino A
Bought by
Burrell Eula F and Burrell Jeffrey P
Home Financials for this Owner
Home Financials are based on the most recent Mortgage that was taken out on this home.
Original Mortgage
$88,900
Interest Rate
8%
Mortgage Type
FHA
Purchase Details
Closed on
Mar 21, 1989
Sold by
Szczech Regina
Bought by
Chiabai Valentino A
Purchase Details
Closed on
Mar 10, 1989
Sold by
Szczech Anton and Szczech Regina
Bought by
Szczech Regina
Purchase Details
Closed on
Jan 1, 1975
Bought by
Szczech Anton and Szczech Regina
Create a Home Valuation Report for This Property
The Home Valuation Report is an in-depth analysis detailing your home's value as well as a comparison with similar homes in the area
Home Values in the Area
Average Home Value in this Area
Purchase History
| Date | Buyer | Sale Price | Title Company |
|---|---|---|---|
| Burrell Jeffrey P | -- | -- | |
| Burrell Eula F | $88,900 | -- | |
| Chiabai Valentino A | $65,500 | -- | |
| Szczech Regina | -- | -- | |
| Szczech Anton | -- | -- |
Source: Public Records
Mortgage History
| Date | Status | Borrower | Loan Amount |
|---|---|---|---|
| Closed | Burrell Jeffrey P | $89,380 | |
| Closed | Burrell Eula F | $88,900 |
Source: Public Records
Tax History
| Year | Tax Paid | Tax Assessment Tax Assessment Total Assessment is a certain percentage of the fair market value that is determined by local assessors to be the total taxable value of land and additions on the property. | Land | Improvement |
|---|---|---|---|---|
| 2025 | $3,491 | $42,525 | $8,925 | $33,600 |
| 2024 | $3,885 | $42,525 | $8,925 | $33,600 |
| 2023 | $3,017 | $28,280 | $7,350 | $20,930 |
| 2022 | $3,007 | $28,280 | $7,350 | $20,930 |
| 2021 | $3,212 | $28,280 | $7,350 | $20,930 |
| 2020 | $2,923 | $23,170 | $6,020 | $17,150 |
| 2019 | $2,909 | $66,200 | $17,200 | $49,000 |
| 2018 | $2,824 | $23,170 | $6,020 | $17,150 |
| 2017 | $2,958 | $23,210 | $5,250 | $17,960 |
| 2016 | $2,860 | $23,210 | $5,250 | $17,960 |
| 2015 | $2,726 | $23,210 | $5,250 | $17,960 |
| 2014 | $2,726 | $23,910 | $5,430 | $18,480 |
Source: Public Records
Map
Nearby Homes
- 15521 Corkhill Rd
- 15712 Mendota Ave
- 14750 Schreiber Rd
- 15405 Turney Rd
- 15522 Turney Rd
- 6089 Dunham Rd
- 14956 Carol Dr
- 15401 Walvern Blvd
- 15513 Walvern Blvd
- 16014 Turney Rd
- 14357 Turney Rd
- 6045 Dunham Rd
- 15305 Steinway Blvd
- 15701 Walvern Blvd
- SL15 Rocky Top Ct
- 15 Rockytop Ct
- 6378 Valley Ranch Dr
- 6372 Valley Ranch Dr
- 5948 Dunham Rd
- 6425 Farmington Dr
- 6254 Dunham Rd
- 6262 Dunham Rd
- 6250 Dunham Rd
- 6268 Dunham Rd
- 6244 Dunham Rd
- 6272 Dunham Rd
- 6240 Dunham Rd
- 6280 Dunham Rd
- 6236 Dunham Rd
- 6265 Dunham Rd
- 6271 Dunham Rd
- 6261 Dunham Rd
- 15201 Woodbrook Ave
- 6232 Dunham Rd
- 6286 Dunham Rd
- 6251 Dunham Rd
- 15205 Woodbrook Ave
- 6290 Dunham Rd
- 6241 Dunham Rd
- 15209 Woodbrook Ave
Your Personal Tour Guide
Ask me questions while you tour the home.