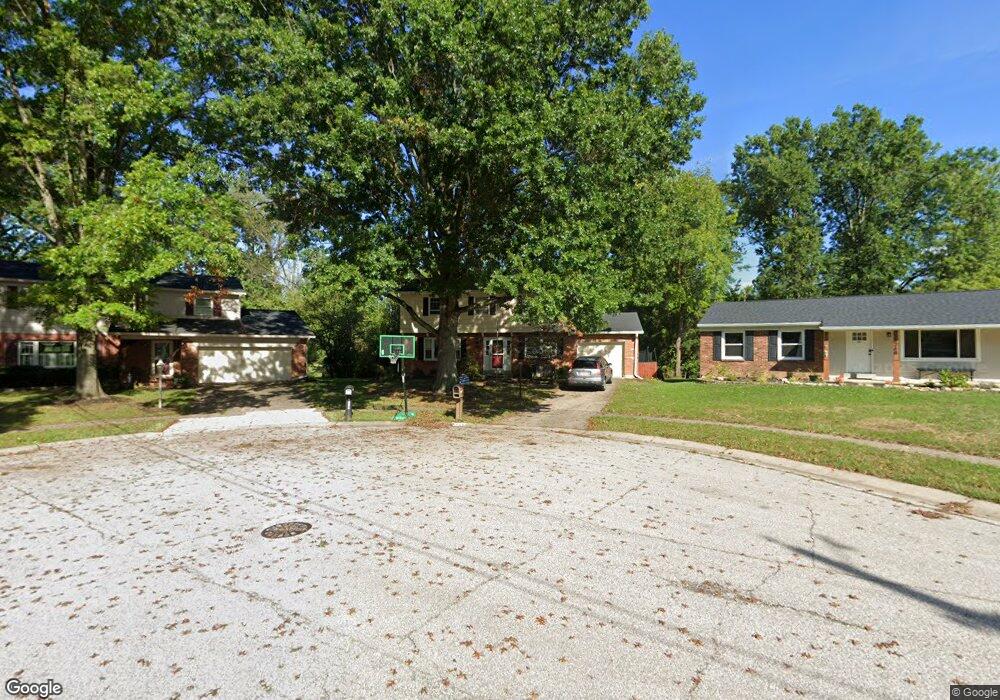
6258 Twig Ln Cincinnati, OH 45230
Salem Heights NeighborhoodEstimated Value: $315,000 - $371,000
4
Beds
3
Baths
1,836
Sq Ft
$185/Sq Ft
Est. Value
About This Home
This home is located at 6258 Twig Ln, Cincinnati, OH 45230 and is currently estimated at $338,887, approximately $184 per square foot. 6258 Twig Ln is a home located in Hamilton County with nearby schools including Maddux Elementary School, Nagel Middle School, and Anderson High School.
Ownership History
Date
Name
Owned For
Owner Type
Purchase Details
Closed on
Jun 5, 2023
Sold by
Ayers James R
Bought by
Ayers Christine E
Current Estimated Value
Purchase Details
Closed on
Aug 1, 2008
Sold by
Wolff John E and Wolff Elizabeth A
Bought by
Ayers James R and Ayers Christine E
Home Financials for this Owner
Home Financials are based on the most recent Mortgage that was taken out on this home.
Original Mortgage
$147,682
Interest Rate
6.39%
Mortgage Type
FHA
Create a Home Valuation Report for This Property
The Home Valuation Report is an in-depth analysis detailing your home's value as well as a comparison with similar homes in the area
Home Values in the Area
Average Home Value in this Area
Purchase History
| Date | Buyer | Sale Price | Title Company |
|---|---|---|---|
| Ayers Christine E | -- | None Listed On Document | |
| Ayers James R | $150,000 | Attorney |
Source: Public Records
Mortgage History
| Date | Status | Borrower | Loan Amount |
|---|---|---|---|
| Previous Owner | Ayers James R | $147,682 |
Source: Public Records
Tax History
| Year | Tax Paid | Tax Assessment Tax Assessment Total Assessment is a certain percentage of the fair market value that is determined by local assessors to be the total taxable value of land and additions on the property. | Land | Improvement |
|---|---|---|---|---|
| 2025 | $5,931 | $94,924 | $15,516 | $79,408 |
| 2023 | $5,483 | $94,924 | $15,516 | $79,408 |
| 2022 | $4,245 | $65,436 | $15,239 | $50,197 |
| 2021 | $4,145 | $65,436 | $15,239 | $50,197 |
| 2020 | $4,192 | $65,436 | $15,239 | $50,197 |
| 2019 | $4,086 | $57,908 | $13,486 | $44,422 |
| 2018 | $3,828 | $57,908 | $13,486 | $44,422 |
| 2017 | $3,610 | $57,908 | $13,486 | $44,422 |
| 2016 | $3,602 | $56,459 | $13,510 | $42,949 |
| 2015 | $3,499 | $56,459 | $13,510 | $42,949 |
| 2014 | $3,458 | $55,762 | $13,510 | $42,252 |
| 2013 | $3,205 | $54,667 | $13,244 | $41,423 |
Source: Public Records
Map
Nearby Homes
Your Personal Tour Guide
Ask me questions while you tour the home.