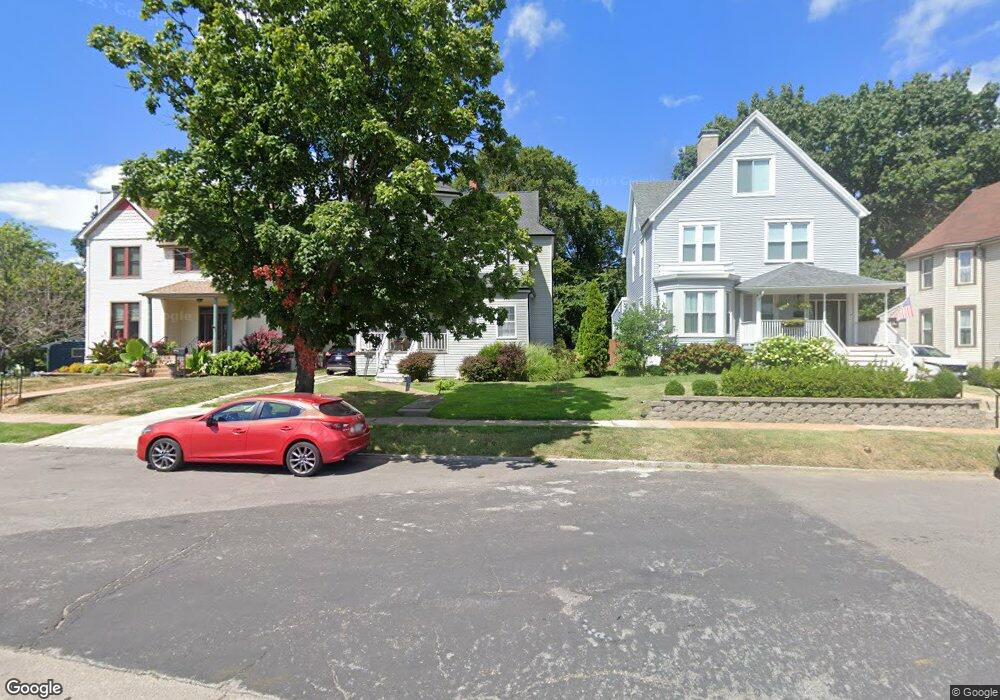
6259 Columbia Ave Saint Louis, MO 63139
Clifton Heights NeighborhoodEstimated Value: $285,000 - $381,196
3
Beds
2
Baths
2,258
Sq Ft
$151/Sq Ft
Est. Value
About This Home
This home is located at 6259 Columbia Ave, Saint Louis, MO 63139 and is currently estimated at $341,799, approximately $151 per square foot. 6259 Columbia Ave is a home located in St. Louis City with nearby schools including Mason Elementary School, Long International Middle School, and Roosevelt High School.
Ownership History
Date
Name
Owned For
Owner Type
Purchase Details
Closed on
Jun 13, 2017
Sold by
Evers Christopher S and Evers June A
Bought by
Sharpe William W and Eggemeyer Linda M
Current Estimated Value
Home Financials for this Owner
Home Financials are based on the most recent Mortgage that was taken out on this home.
Original Mortgage
$200,600
Outstanding Balance
$166,857
Interest Rate
4.02%
Mortgage Type
New Conventional
Estimated Equity
$174,942
Purchase Details
Closed on
Mar 12, 2011
Sold by
Evers Christopher S and Evers June A
Bought by
Evers Christopher S and Evers June A
Home Financials for this Owner
Home Financials are based on the most recent Mortgage that was taken out on this home.
Original Mortgage
$207,050
Interest Rate
4.78%
Mortgage Type
FHA
Purchase Details
Closed on
Jan 28, 1998
Sold by
Guttormson Thomas L and Guttormson Dolores J
Bought by
Evers Christopher S
Home Financials for this Owner
Home Financials are based on the most recent Mortgage that was taken out on this home.
Original Mortgage
$76,380
Interest Rate
7.07%
Mortgage Type
FHA
Create a Home Valuation Report for This Property
The Home Valuation Report is an in-depth analysis detailing your home's value as well as a comparison with similar homes in the area
Home Values in the Area
Average Home Value in this Area
Purchase History
| Date | Buyer | Sale Price | Title Company |
|---|---|---|---|
| Sharpe William W | $250,750 | None Available | |
| Evers Christopher S | -- | Touchstone Title & Abstract | |
| Evers Christopher S | -- | -- |
Source: Public Records
Mortgage History
| Date | Status | Borrower | Loan Amount |
|---|---|---|---|
| Open | Sharpe William W | $200,600 | |
| Previous Owner | Evers Christopher S | $207,050 | |
| Previous Owner | Evers Christopher S | $76,380 |
Source: Public Records
Tax History Compared to Growth
Tax History
| Year | Tax Paid | Tax Assessment Tax Assessment Total Assessment is a certain percentage of the fair market value that is determined by local assessors to be the total taxable value of land and additions on the property. | Land | Improvement |
|---|---|---|---|---|
| 2025 | $4,038 | $57,720 | $3,330 | $54,390 |
| 2024 | $3,841 | $47,910 | $3,330 | $44,580 |
| 2023 | $3,841 | $47,910 | $3,330 | $44,580 |
| 2022 | $3,507 | $42,090 | $3,330 | $38,760 |
| 2021 | $3,502 | $42,090 | $3,330 | $38,760 |
| 2020 | $3,161 | $38,250 | $3,330 | $34,920 |
| 2019 | $3,150 | $38,250 | $3,330 | $34,920 |
| 2018 | $2,145 | $25,140 | $3,330 | $21,810 |
| 2017 | $2,108 | $25,140 | $3,330 | $21,810 |
| 2016 | $1,498 | $17,540 | $3,330 | $14,210 |
| 2015 | $1,359 | $17,540 | $3,330 | $14,210 |
| 2014 | $1,322 | $17,540 | $3,330 | $14,210 |
| 2013 | -- | $17,070 | $3,330 | $13,740 |
Source: Public Records
Map
Nearby Homes
- 6215 Columbia Ave
- 6285 Magnolia Ave
- 6140 Columbia Ave
- 6133 Magnolia Ave
- 6266 Marmaduke Ave
- 2817 Knox Ct
- 6541 Southwest Ave
- 6445 Odell St
- 6537 Marmaduke Ave
- 6547 Marmaduke Ave
- 2164 Knox Ave
- 6035 Elizabeth Ave
- 6020 Southwest Ave
- 6012 Odell St
- 2715 Watson Rd
- 6439 Arsenal St
- 6568 Odell St
- 6426 Arsenal St
- 6023 Arsenal St
- 2022 Knox Ave
- 6265 Columbia Ave
- 6247 Columbia Ave
- 2644 Tamm Ave
- 6241 Columbia Ave
- 2640 Tamm Ave
- 2636 Tamm Ave
- 2632 Tamm Ave
- 15471549 Tamm Ave
- 2628 Tamm Ave
- 2615 Clifton Ave
- 6405 Southwest Ave
- 2645 Tamm Ave
- 2624 Tamm Ave
- 2611 Clifton Ave
- 6239 Columbia Ave
- 2623 Clifton Ave
- 2620 Tamm Ave
- 6400 Clifton Hills Dr
- 6411 Southwest Ave
- 6233 Columbia Ave