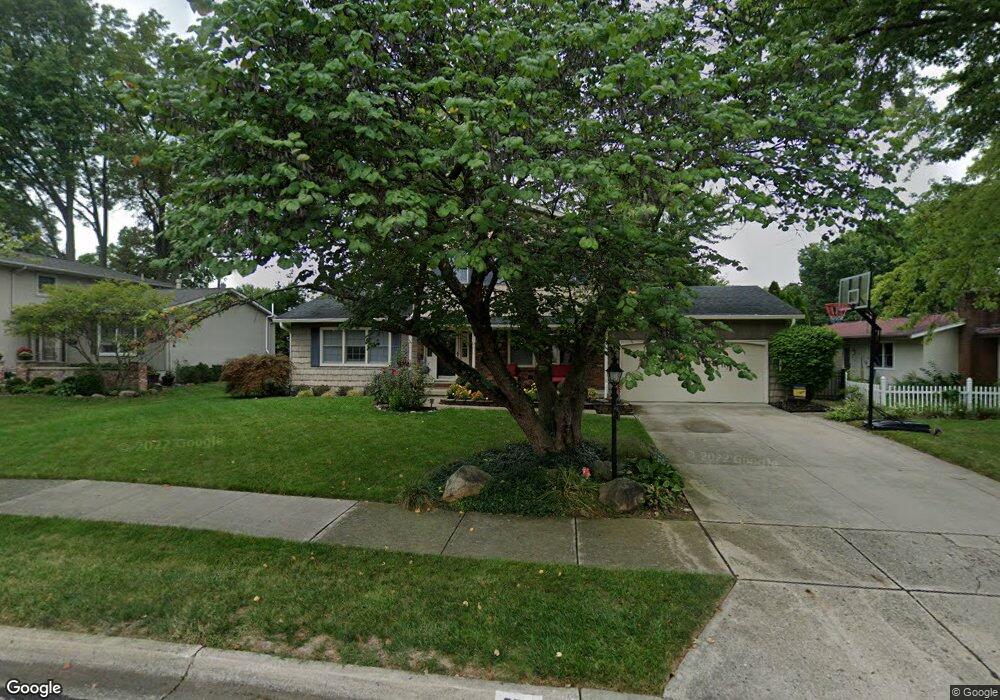
626 Berkeley Place S Westerville, OH 43081
Estimated Value: $460,406 - $476,000
3
Beds
4
Baths
2,325
Sq Ft
$202/Sq Ft
Est. Value
About This Home
This home is located at 626 Berkeley Place S, Westerville, OH 43081 and is currently estimated at $468,852, approximately $201 per square foot. 626 Berkeley Place S is a home located in Franklin County with nearby schools including Annehurst Elementary School, Heritage Middle School, and Westerville South High School.
Ownership History
Date
Name
Owned For
Owner Type
Purchase Details
Closed on
Oct 31, 2011
Sold by
Riddle Paul J and Riddle Rachel F
Bought by
Herman Nicole Ann and Herman Scott Gabriel
Current Estimated Value
Home Financials for this Owner
Home Financials are based on the most recent Mortgage that was taken out on this home.
Original Mortgage
$174,065
Outstanding Balance
$119,096
Interest Rate
4.09%
Mortgage Type
New Conventional
Estimated Equity
$349,756
Purchase Details
Closed on
Apr 18, 2002
Sold by
Malarick Timothy E
Bought by
Riddle Paul J and Riddle Rachel F
Purchase Details
Closed on
Oct 1, 1992
Bought by
Malarick Timothy E
Purchase Details
Closed on
Nov 10, 1988
Create a Home Valuation Report for This Property
The Home Valuation Report is an in-depth analysis detailing your home's value as well as a comparison with similar homes in the area
Home Values in the Area
Average Home Value in this Area
Purchase History
| Date | Buyer | Sale Price | Title Company |
|---|---|---|---|
| Herman Nicole Ann | $191,000 | Stewart Tit | |
| Riddle Paul J | $163,500 | -- | |
| Malarick Timothy E | -- | -- | |
| -- | $105,000 | -- |
Source: Public Records
Mortgage History
| Date | Status | Borrower | Loan Amount |
|---|---|---|---|
| Open | Herman Nicole Ann | $174,065 |
Source: Public Records
Tax History Compared to Growth
Tax History
| Year | Tax Paid | Tax Assessment Tax Assessment Total Assessment is a certain percentage of the fair market value that is determined by local assessors to be the total taxable value of land and additions on the property. | Land | Improvement |
|---|---|---|---|---|
| 2024 | $7,197 | $126,630 | $29,750 | $96,880 |
| 2023 | $7,044 | $126,630 | $29,750 | $96,880 |
| 2022 | $6,490 | $89,080 | $19,360 | $69,720 |
| 2021 | $6,544 | $89,080 | $19,360 | $69,720 |
| 2020 | $6,526 | $89,080 | $19,360 | $69,720 |
| 2019 | $5,949 | $76,660 | $19,360 | $57,300 |
| 2018 | $5,548 | $76,660 | $19,360 | $57,300 |
| 2017 | $5,851 | $76,660 | $19,360 | $57,300 |
| 2016 | $5,435 | $64,830 | $21,740 | $43,090 |
| 2015 | $5,264 | $64,830 | $21,740 | $43,090 |
| 2014 | $5,268 | $64,830 | $21,740 | $43,090 |
| 2013 | $2,630 | $64,820 | $21,735 | $43,085 |
Source: Public Records
Map
Nearby Homes
- 101 W Ticonderoga Dr Unit B
- 671 College Crest Rd
- 134 W Ticonderoga Dr Unit D
- 107 W Ticonderoga Dr Unit 3E
- 106 E Ticonderoga Dr
- 106 E Ticonderoga Dr Unit A
- 658 River Trace
- 640 Glacier Pass
- 199 Granby Place W
- 190 Bellefield Ave
- 258 Bellefield Ave
- 828 Memories Ln
- 1095 Belle Meade Place
- 106 Ormsbee Ave
- 321 Pinnate Ln Unit Lot 1504
- 322 Pinnate Ln Unit Lot 1201
- 327 Pinnate Ln Unit Lot 1502
- 324 Pinnate Ln Unit Lot 1202
- 331 Pinnate Ln Unit Lot 1501
- 328 Pinnate Ln Unit Lot 1203
- 622 Berkeley Place S
- 633 Berkeley Place N
- 645 Berkeley Place N
- 618 Berkeley Place S
- 637 Berkeley Place N
- 649 Berkeley Place N
- 621 Berkeley Place S
- 617 Berkeley Place N
- 617 Berkeley Place S
- 653 Berkeley Place N
- 625 Berkeley Place S
- 613 Berkeley Place S
- 614 Berkeley Place S
- 638 Berkeley Place N
- 638 Berkeley Place S
- 642 Berkeley Place N
- 657 Berkeley Place N
- 609 Berkeley Place S
- 629 Berkeley Place S
- 646 Berkeley Place N