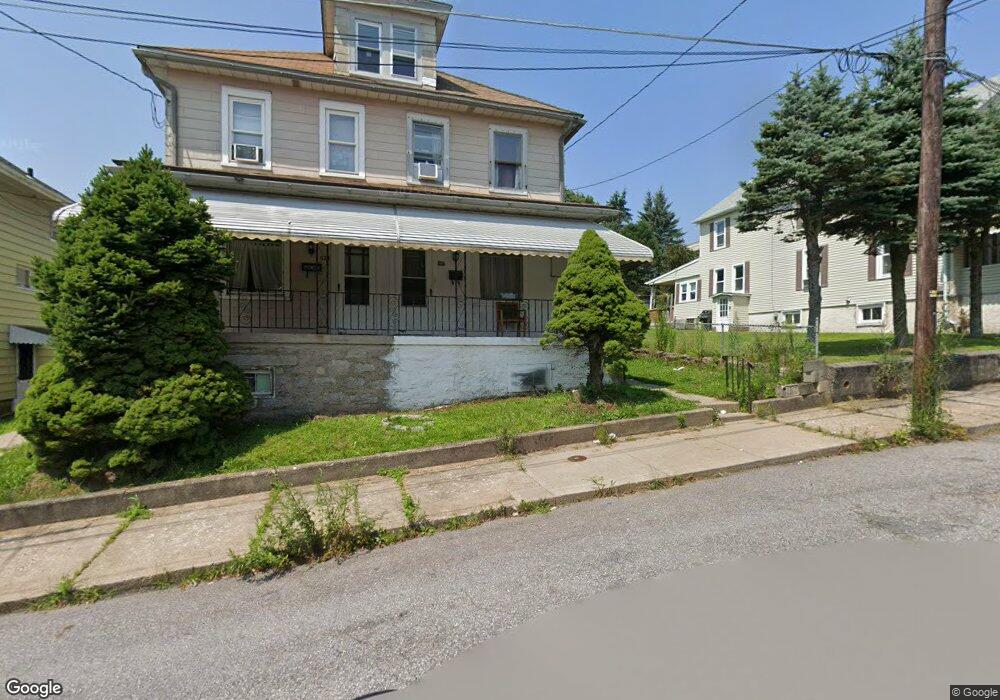
626 Cedar St Freeland, PA 18224
Estimated Value: $88,328 - $159,000
--
Bed
--
Bath
1,400
Sq Ft
$88/Sq Ft
Est. Value
About This Home
This home is located at 626 Cedar St, Freeland, PA 18224 and is currently estimated at $123,332, approximately $88 per square foot. 626 Cedar St is a home located in Luzerne County with nearby schools including Hazleton Area High School and Mmi Preparatory School.
Ownership History
Date
Name
Owned For
Owner Type
Purchase Details
Closed on
Jun 23, 2022
Sold by
Caffrey Megan H
Bought by
Vercusky Thomas
Current Estimated Value
Purchase Details
Closed on
Jul 25, 2005
Sold by
Onge Norman St and Onge Renedda J St
Bought by
Caffery Megan H
Home Financials for this Owner
Home Financials are based on the most recent Mortgage that was taken out on this home.
Original Mortgage
$28,800
Interest Rate
5.13%
Mortgage Type
New Conventional
Create a Home Valuation Report for This Property
The Home Valuation Report is an in-depth analysis detailing your home's value as well as a comparison with similar homes in the area
Home Values in the Area
Average Home Value in this Area
Purchase History
| Date | Buyer | Sale Price | Title Company |
|---|---|---|---|
| Vercusky Thomas | $30,000 | New Title Company Name | |
| Caffery Megan H | $36,000 | None Available |
Source: Public Records
Mortgage History
| Date | Status | Borrower | Loan Amount |
|---|---|---|---|
| Previous Owner | Caffery Megan H | $28,800 |
Source: Public Records
Tax History Compared to Growth
Tax History
| Year | Tax Paid | Tax Assessment Tax Assessment Total Assessment is a certain percentage of the fair market value that is determined by local assessors to be the total taxable value of land and additions on the property. | Land | Improvement |
|---|---|---|---|---|
| 2025 | $1,009 | $49,000 | $21,500 | $27,500 |
| 2024 | $968 | $49,000 | $21,500 | $27,500 |
| 2023 | $950 | $49,000 | $21,500 | $27,500 |
| 2022 | $941 | $49,000 | $21,500 | $27,500 |
| 2021 | $912 | $49,000 | $21,500 | $27,500 |
| 2020 | $876 | $49,000 | $21,500 | $27,500 |
| 2019 | $839 | $49,000 | $21,500 | $27,500 |
| 2018 | $807 | $49,000 | $21,500 | $27,500 |
| 2017 | $790 | $49,000 | $21,500 | $27,500 |
| 2016 | -- | $49,000 | $21,500 | $27,500 |
| 2015 | $340 | $49,000 | $21,500 | $27,500 |
| 2014 | $340 | $49,000 | $21,500 | $27,500 |
Source: Public Records
Map
Nearby Homes