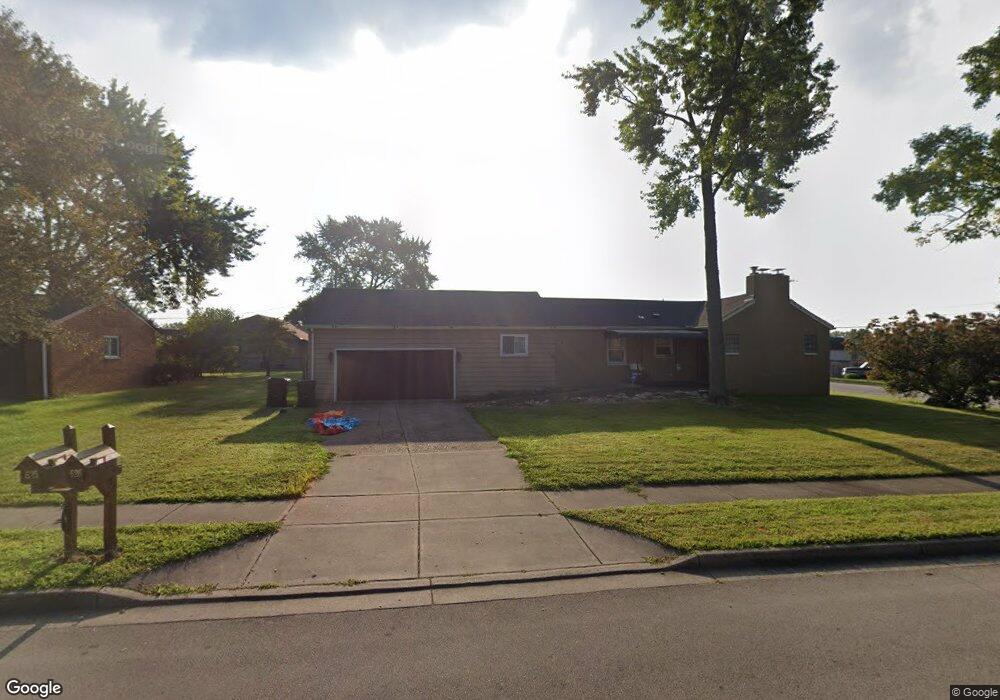
626 Fallview Ave Englewood, OH 45322
Estimated Value: $190,000 - $208,777
3
Beds
1
Bath
1,351
Sq Ft
$149/Sq Ft
Est. Value
About This Home
This home is located at 626 Fallview Ave, Englewood, OH 45322 and is currently estimated at $201,944, approximately $149 per square foot. 626 Fallview Ave is a home located in Montgomery County with nearby schools including Northmont High School, Trotwood Preparatory & Fitness Academy, and Imagine Schools - Woodbury Academy.
Ownership History
Date
Name
Owned For
Owner Type
Purchase Details
Closed on
Nov 17, 2021
Sold by
Roberts Hal D
Bought by
Davis Tenishia N
Current Estimated Value
Home Financials for this Owner
Home Financials are based on the most recent Mortgage that was taken out on this home.
Original Mortgage
$154,156
Outstanding Balance
$140,043
Interest Rate
2.98%
Mortgage Type
FHA
Estimated Equity
$61,901
Purchase Details
Closed on
Nov 22, 2019
Sold by
Coffey Cheryl L and Behne Donna K
Bought by
Roberts Hal D
Home Financials for this Owner
Home Financials are based on the most recent Mortgage that was taken out on this home.
Original Mortgage
$92,800
Interest Rate
3.75%
Mortgage Type
New Conventional
Purchase Details
Closed on
Apr 8, 2015
Sold by
Coffey Cheryl L
Bought by
Coffey Cheryl L and Behne Donna K
Home Financials for this Owner
Home Financials are based on the most recent Mortgage that was taken out on this home.
Original Mortgage
$87,900
Interest Rate
3.04%
Mortgage Type
New Conventional
Purchase Details
Closed on
Apr 11, 2002
Sold by
Coffey Cheryl L and Liebel Cynthia J
Bought by
Coffey Cheryl L
Create a Home Valuation Report for This Property
The Home Valuation Report is an in-depth analysis detailing your home's value as well as a comparison with similar homes in the area
Home Values in the Area
Average Home Value in this Area
Purchase History
| Date | Buyer | Sale Price | Title Company |
|---|---|---|---|
| Davis Tenishia N | $157,000 | Fidelity Lawyers Ttl Agcy Ll | |
| Roberts Hal D | $116,000 | Landmark Ttl Agcy South Inc | |
| Coffey Cheryl L | $80,400 | First American Title Ins Co | |
| Coffey Cheryl L | -- | -- |
Source: Public Records
Mortgage History
| Date | Status | Borrower | Loan Amount |
|---|---|---|---|
| Open | Davis Tenishia N | $154,156 | |
| Previous Owner | Roberts Hal D | $92,800 | |
| Previous Owner | Coffey Cheryl L | $87,900 |
Source: Public Records
Tax History
| Year | Tax Paid | Tax Assessment Tax Assessment Total Assessment is a certain percentage of the fair market value that is determined by local assessors to be the total taxable value of land and additions on the property. | Land | Improvement |
|---|---|---|---|---|
| 2025 | $3,589 | $60,970 | $8,530 | $52,440 |
| 2024 | $3,477 | $60,970 | $8,530 | $52,440 |
| 2023 | $3,477 | $60,970 | $8,530 | $52,440 |
| 2022 | $3,034 | $40,930 | $5,730 | $35,200 |
| 2021 | $3,043 | $40,930 | $5,730 | $35,200 |
| 2020 | $3,059 | $40,930 | $5,730 | $35,200 |
| 2019 | $2,246 | $26,880 | $5,730 | $21,150 |
| 2018 | $2,206 | $26,880 | $5,730 | $21,150 |
| 2017 | $2,193 | $26,880 | $5,730 | $21,150 |
| 2016 | $2,134 | $25,690 | $5,730 | $19,960 |
| 2015 | $1,956 | $25,690 | $5,730 | $19,960 |
| 2014 | $1,956 | $25,690 | $5,730 | $19,960 |
| 2012 | -- | $28,190 | $5,730 | $22,460 |
Source: Public Records
Map
Nearby Homes
- 806 Mcgraw Ct
- 803 Albert St
- 916 S Main St
- 502 S Main St
- 301 Autumn Ct
- 320 Autumn Ct
- 113 Lodestone Dr
- 1011 Hazel Ave
- 130 Allison Ct
- 1028 Hazel Ave
- 511 Rohr Ln
- 505 Durst Dr
- 440 Katy Ln
- 213 Porter Dr
- 309 Winterset Dr
- 117 Candle Ct Unit 740
- 5401 Hillgrove Ave
- 7275 Mckenna Place
- 5420 Savina Ave
- 5282 Rahway Ct
- 620 Fallview Ave
- 700 Fallview Ave
- 621 Woodside Dr
- 701 Taywood Rd
- 625 Fallview Ave
- 701 Fallview Ave
- 705 Fallview Ave
- 704 Fallview Ave
- 705 Taywood Rd
- 614 Fallview Ave
- 613 Fallview Ave
- 620 Bonnycastle Ave
- 614 Bonnycastle Ave
- 706 Fallview Ave
- 609 Woodside Dr
- 610 Fallview Ave
- 709 Taywood Rd
- 707 Fallview Ave
- 610 Bonnycastle Ave
- 609 Fallview Ave
Your Personal Tour Guide
Ask me questions while you tour the home.