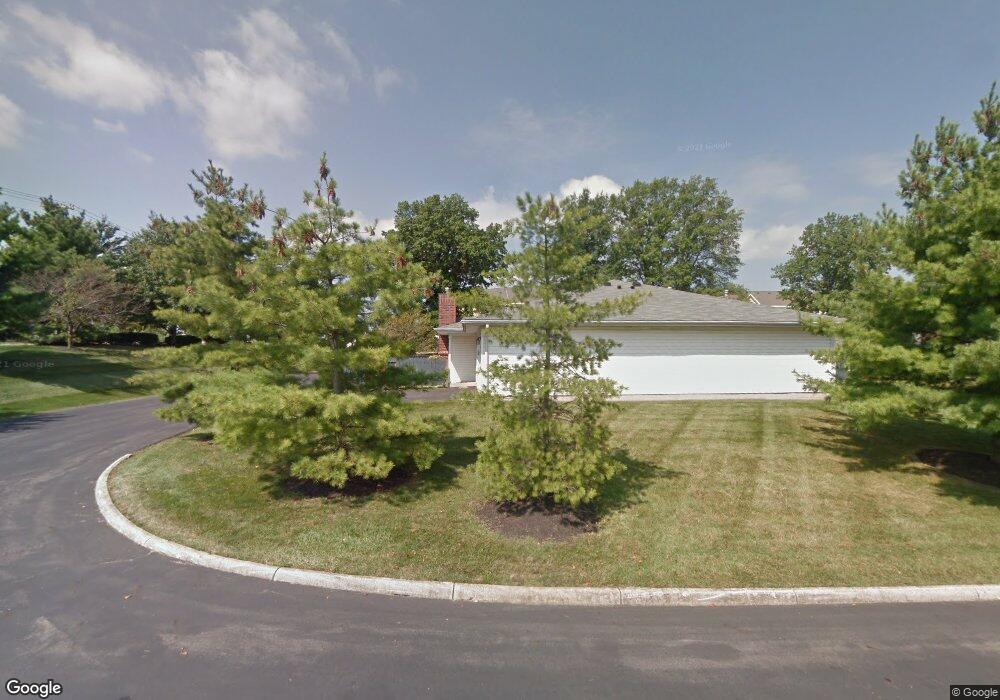
626 Lazelle Rd Unit 626 Columbus, OH 43240
Polaris South NeighborhoodEstimated Value: $259,000 - $283,000
2
Beds
2
Baths
1,001
Sq Ft
$268/Sq Ft
Est. Value
About This Home
This home is located at 626 Lazelle Rd Unit 626, Columbus, OH 43240 and is currently estimated at $268,033, approximately $267 per square foot. 626 Lazelle Rd Unit 626 is a home located in Delaware County with nearby schools including Olentangy Meadows Elementary School, Olentangy Orange Middle School, and Orange High School.
Ownership History
Date
Name
Owned For
Owner Type
Purchase Details
Closed on
Jul 27, 2005
Sold by
Anderson Wayne A and Anderson Marianne
Bought by
Franks Shelley A
Current Estimated Value
Home Financials for this Owner
Home Financials are based on the most recent Mortgage that was taken out on this home.
Original Mortgage
$105,850
Outstanding Balance
$55,783
Interest Rate
5.71%
Mortgage Type
Fannie Mae Freddie Mac
Estimated Equity
$212,250
Purchase Details
Closed on
Jun 26, 2001
Sold by
Grim Charles R
Bought by
Anderson Wayne A and Anderson Marianne
Home Financials for this Owner
Home Financials are based on the most recent Mortgage that was taken out on this home.
Original Mortgage
$42,000
Interest Rate
6.64%
Mortgage Type
New Conventional
Purchase Details
Closed on
May 30, 1997
Sold by
Village Communities Corp
Bought by
Grim Charles R and Grim Leona M
Home Financials for this Owner
Home Financials are based on the most recent Mortgage that was taken out on this home.
Original Mortgage
$40,100
Interest Rate
8.27%
Mortgage Type
New Conventional
Create a Home Valuation Report for This Property
The Home Valuation Report is an in-depth analysis detailing your home's value as well as a comparison with similar homes in the area
Home Values in the Area
Average Home Value in this Area
Purchase History
| Date | Buyer | Sale Price | Title Company |
|---|---|---|---|
| Franks Shelley A | $132,500 | Chicago Title | |
| Anderson Wayne A | $112,000 | -- | |
| Grim Charles R | $102,900 | -- |
Source: Public Records
Mortgage History
| Date | Status | Borrower | Loan Amount |
|---|---|---|---|
| Open | Franks Shelley A | $105,850 | |
| Previous Owner | Anderson Wayne A | $42,000 | |
| Previous Owner | Grim Charles R | $40,100 |
Source: Public Records
Tax History Compared to Growth
Tax History
| Year | Tax Paid | Tax Assessment Tax Assessment Total Assessment is a certain percentage of the fair market value that is determined by local assessors to be the total taxable value of land and additions on the property. | Land | Improvement |
|---|---|---|---|---|
| 2024 | $4,133 | $84,980 | $17,150 | $67,830 |
| 2023 | $4,151 | $84,980 | $17,150 | $67,830 |
| 2022 | $3,255 | $53,060 | $12,250 | $40,810 |
| 2021 | $3,273 | $53,060 | $12,250 | $40,810 |
| 2020 | $3,292 | $53,060 | $12,250 | $40,810 |
| 2019 | $2,405 | $40,880 | $8,750 | $32,130 |
| 2018 | $2,416 | $40,880 | $8,750 | $32,130 |
| 2017 | $2,277 | $38,500 | $7,000 | $31,500 |
| 2016 | $2,414 | $38,500 | $7,000 | $31,500 |
| 2015 | $2,166 | $38,500 | $7,000 | $31,500 |
| 2014 | $2,198 | $38,500 | $7,000 | $31,500 |
| 2013 | $2,248 | $38,500 | $7,000 | $31,500 |
Source: Public Records
Map
Nearby Homes
- 8321 Sable Crossing Dr
- 8361 Sable Crossing Dr Unit 8361
- 1113 Green Knoll Dr Unit 1113
- 1193 Hollytree Ln Unit 1193
- 8133 Worthington Crossing Dr
- 1296 Blacksmith Dr
- 7916 Sudeley Ct
- 7940 Schoolside Dr
- 889 Pelham Ct
- 8293 Mira St Unit 175
- 7852 Heathcock Ct
- 874 Charnwood Ln Unit 5D
- 7850 Malton Ln Unit 14E
- 1212 Tillicum Dr
- 7981 Oakwind Ct
- 1291 Worthington Creek Dr Unit 7
- 7685 Whitneyway Dr Unit 17
- 687 Sanville Dr
- 7634 Kelvinway Dr Unit 150
- 7697 Barkwood Dr Unit 1D
- 8305 Sable Crossing Dr Unit 8305
- 8307 Sable Crossing Dr
- 624 Greyhawk Cir
- 624 Lazelle Rd Unit 624
- 8323 Sable Crossing Dr Unit 8323
- 632 Lazelle Rd
- 8300 Greyhawk Cir Unit 8300
- 8325 Sable Crossing Dr Unit 8325
- 8328 Sable Crossing Dr
- 8326 Sable Crossing Dr Unit 8326
- 8327 Sable Crossing Dr Unit 8327
- 8324 Sable Crossing Dr Unit 8324
- 8302 Greyhawk Cir Unit 8302
- 634 Lazelle Rd Unit 634
- 8330 Sable Crossing Dr
- 8343 Sable Crossing Dr
- 8311 Greyhawk Cir
- 611 Lazelle Rd
- 623 Lazelle Rd
- 615 Lazelle Rd