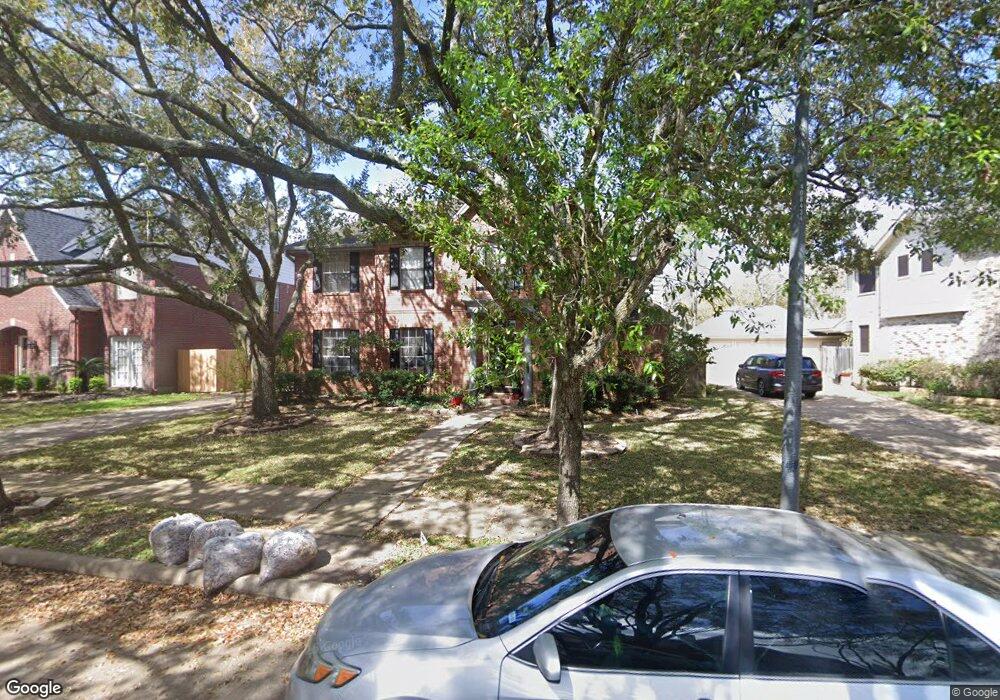
626 Lorfing Ln Sugar Land, TX 77479
New Territory NeighborhoodEstimated Value: $450,580 - $510,000
4
Beds
4
Baths
2,962
Sq Ft
$166/Sq Ft
Est. Value
About This Home
This home is located at 626 Lorfing Ln, Sugar Land, TX 77479 and is currently estimated at $491,395, approximately $165 per square foot. 626 Lorfing Ln is a home located in Fort Bend County with nearby schools including Walker Station Elementary School, Sartartia Middle School, and Stephen F Austin High School.
Ownership History
Date
Name
Owned For
Owner Type
Purchase Details
Closed on
May 31, 2000
Sold by
Prudential Residential Svcs Ltd Prtnrshp
Bought by
Punnakkal Jagadeesh and Jagadeesh Rija
Current Estimated Value
Home Financials for this Owner
Home Financials are based on the most recent Mortgage that was taken out on this home.
Original Mortgage
$148,800
Outstanding Balance
$52,271
Interest Rate
8.17%
Estimated Equity
$439,124
Purchase Details
Closed on
Feb 13, 1997
Sold by
Zager John P and Zager Susan G
Bought by
Ledbetter Russell P and Ledbetter Linda L
Home Financials for this Owner
Home Financials are based on the most recent Mortgage that was taken out on this home.
Original Mortgage
$149,850
Interest Rate
7.82%
Purchase Details
Closed on
Oct 23, 1992
Sold by
Tmi Inc
Bought by
Punnakkal Jagadeesh and Rija Jagadeesh
Create a Home Valuation Report for This Property
The Home Valuation Report is an in-depth analysis detailing your home's value as well as a comparison with similar homes in the area
Home Values in the Area
Average Home Value in this Area
Purchase History
| Date | Buyer | Sale Price | Title Company |
|---|---|---|---|
| Punnakkal Jagadeesh | -- | Texas American Title Company | |
| Prudential Residential Svcs Ltd Prtnrshp | -- | Texas American Title Company | |
| Ledbetter Russell P | -- | Charter Title Company | |
| Punnakkal Jagadeesh | -- | -- | |
| Punnakkal Jagadeesh | -- | -- |
Source: Public Records
Mortgage History
| Date | Status | Borrower | Loan Amount |
|---|---|---|---|
| Open | Punnakkal Jagadeesh | $148,800 | |
| Previous Owner | Punnakkal Jagadeesh | $149,850 |
Source: Public Records
Tax History Compared to Growth
Tax History
| Year | Tax Paid | Tax Assessment Tax Assessment Total Assessment is a certain percentage of the fair market value that is determined by local assessors to be the total taxable value of land and additions on the property. | Land | Improvement |
|---|---|---|---|---|
| 2025 | $7,248 | $431,169 | $74,100 | $357,069 |
| 2024 | $7,248 | $417,341 | $39,093 | $378,248 |
| 2023 | $6,567 | $379,401 | $5,575 | $373,826 |
| 2022 | $7,089 | $344,910 | $0 | $362,680 |
| 2021 | $7,649 | $313,550 | $57,000 | $256,550 |
| 2020 | $7,319 | $297,540 | $57,000 | $240,540 |
| 2019 | $7,884 | $325,580 | $57,000 | $268,580 |
| 2018 | $7,992 | $329,340 | $57,000 | $272,340 |
| 2017 | $7,481 | $349,760 | $57,000 | $292,760 |
| 2016 | $7,157 | $334,580 | $57,000 | $277,580 |
| 2015 | $5,320 | $327,080 | $57,000 | $270,080 |
| 2014 | $5,740 | $300,800 | $57,000 | $243,800 |
Source: Public Records
Map
Nearby Homes
- 6334 Wagner Way
- 531 Scarlet Maple Dr
- 6311 Laurel Bush Ln
- 6502 Oakburl Ct
- 16 Treverstone Ct
- 915 Clarenda Falls Dr
- 614 Coggins Point Way
- 6102 Walkers Park Dr
- 806 Lakespur Dr
- 714 Coggins Point Way
- 815 Lakespur Dr
- 1006 Pointe Loma Dr
- 5918 Pendelton Place Dr
- 103 Chatsworth Cir
- 50 Schubach Dr
- 802 Floriencia St
- 7014 Adobe Oaks Ct
- 14 Lake Mist Ct
- 19 Rivercoach Ln
- 6135 Edenbrook Dr
- 630 Lorfing Ln
- 618 Lorfing Ln
- 6311 Wagner Way
- 634 Lorfing Ln
- 6307 Wagner Way
- 610 Lorfing Ln
- 6315 Wagner Way
- 627 Lorfing Ln
- 623 Lorfing Ln
- 631 Lorfing Ln
- 619 Lorfing Ln
- 635 Lorfing Ln
- 615 Lorfing Ln
- 6303 Wagner Way
- 2331 Cr 1076
- 606 Lorfing Ln
- 611 Lorfing Ln
- 703 Lorfing Ln
- 6402 Lussier Dr
- 6326 Wagner Way