626 N 61st Ave Unit 75 x 150 Building Lo West Richland, WA 99353
Estimated Value: $353,000 - $435,000
3
Beds
2
Baths
1,446
Sq Ft
$264/Sq Ft
Est. Value
About This Home
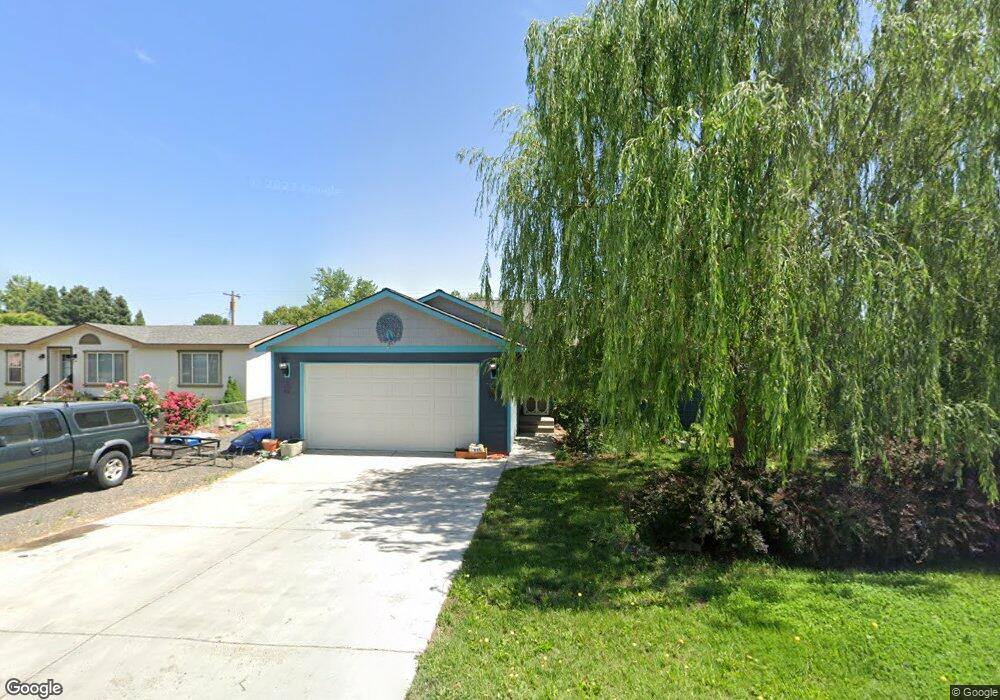
This home is located at 626 N 61st Ave Unit 75 x 150 Building Lo, West Richland, WA 99353 and is currently estimated at $381,104, approximately $263 per square foot. 626 N 61st Ave Unit 75 x 150 Building Lo is a home located in Benton County with nearby schools including Tapteal Elementary School and Hanford High School.
Ownership History
Date
Name
Owned For
Owner Type
Purchase Details
Closed on
Apr 1, 2025
Sold by
Mellgren Holly Jean and Mellgren Branden Ordell
Bought by
Mellgren Branden Ordell
Current Estimated Value
Purchase Details
Closed on
Jan 26, 2016
Sold by
Torres Angel D and Torres Angelica
Bought by
Mellgren Branden and Mellgren Holly
Home Financials for this Owner
Home Financials are based on the most recent Mortgage that was taken out on this home.
Original Mortgage
$182,400
Interest Rate
3.94%
Mortgage Type
New Conventional
Purchase Details
Closed on
Jul 23, 2015
Sold by
Danilyuk Sergey
Bought by
Torres Angel D and Torres Angelica
Purchase Details
Closed on
Sep 12, 2014
Sold by
Drigailo Valentina and Danilyuk Sergey
Bought by
Danilyuk Sergey
Create a Home Valuation Report for This Property
The Home Valuation Report is an in-depth analysis detailing your home's value as well as a comparison with similar homes in the area
Home Values in the Area
Average Home Value in this Area
Purchase History
| Date | Buyer | Sale Price | Title Company |
|---|---|---|---|
| Mellgren Branden Ordell | $313 | None Listed On Document | |
| Mellgren Branden | $192,000 | Tri City Title & Escrow Llc | |
| Torres Angel D | $34,719 | Tri City Title & Escrow | |
| Danilyuk Sergey | -- | Benton Franklin Title Co | |
| Danilyuk Sergey | $20,000 | Benton Franklin Title Co |
Source: Public Records
Mortgage History
| Date | Status | Borrower | Loan Amount |
|---|---|---|---|
| Previous Owner | Mellgren Branden | $182,400 |
Source: Public Records
Tax History Compared to Growth
Tax History
| Year | Tax Paid | Tax Assessment Tax Assessment Total Assessment is a certain percentage of the fair market value that is determined by local assessors to be the total taxable value of land and additions on the property. | Land | Improvement |
|---|---|---|---|---|
| 2024 | $4,074 | $328,540 | $40,000 | $288,540 |
| 2023 | $4,074 | $358,140 | $40,000 | $318,140 |
| 2022 | $3,192 | $261,960 | $40,000 | $221,960 |
| 2021 | $3,013 | $239,760 | $40,000 | $199,760 |
| 2020 | $3,119 | $217,560 | $40,000 | $177,560 |
| 2019 | $2,397 | $217,560 | $40,000 | $177,560 |
| 2018 | $2,722 | $175,720 | $28,000 | $147,720 |
| 2017 | $2,429 | $175,720 | $28,000 | $147,720 |
| 2016 | $536 | $175,720 | $28,000 | $147,720 |
| 2015 | $534 | $30,000 | $28,000 | $2,000 |
| 2014 | -- | $30,000 | $28,000 | $2,000 |
| 2013 | -- | $30,000 | $28,000 | $2,000 |
Source: Public Records
Map
Nearby Homes
- 872 N 60th Ave
- 5830 Gray St
- 961 N 60th Ave
- 3173 Belmont Blvd
- Lot 2 Belmont Blvd
- Lot 3 Belmont Blvd
- 1082 N 61st Ave
- 6504 James St
- 6511 James St
- 5464 Fern Loop
- 324 Mojave Ct
- 6504 Morrison St
- 6334 Hove St
- 5880 S 58th Ave
- 6408 Haag St
- 6530 Meyers St Unit 103
- 5120 Collins Rd
- 104 N 68th Ave
- NKA E Grover Prairie NE
- 64209 E Grover Prairie NE
- 626 N 61st Ave
- 614 N 61st Ave
- 650 N 61st Ave
- 627 N 60th Ave
- 598 N 61st Ave
- 6075 Gray St
- 613 N 60th Ave
- 649 N 60th Ave
- 625 N 61st Ave
- 625 N 61st Ave Unit REDUCED: MFH, .39 Ac
- 595 N 60th Ave
- 595 N 60th Ave Unit AFFORDABLE, FRESHLY
- 681 N 60th Ave
- 591 N 61st Ave
- 576 N 61st Ave
- 689 N 61st Ave
- 714 N 61st Ave
- 573 N 60th Ave
- 534 N 61st Ave
- 6026 Gray St