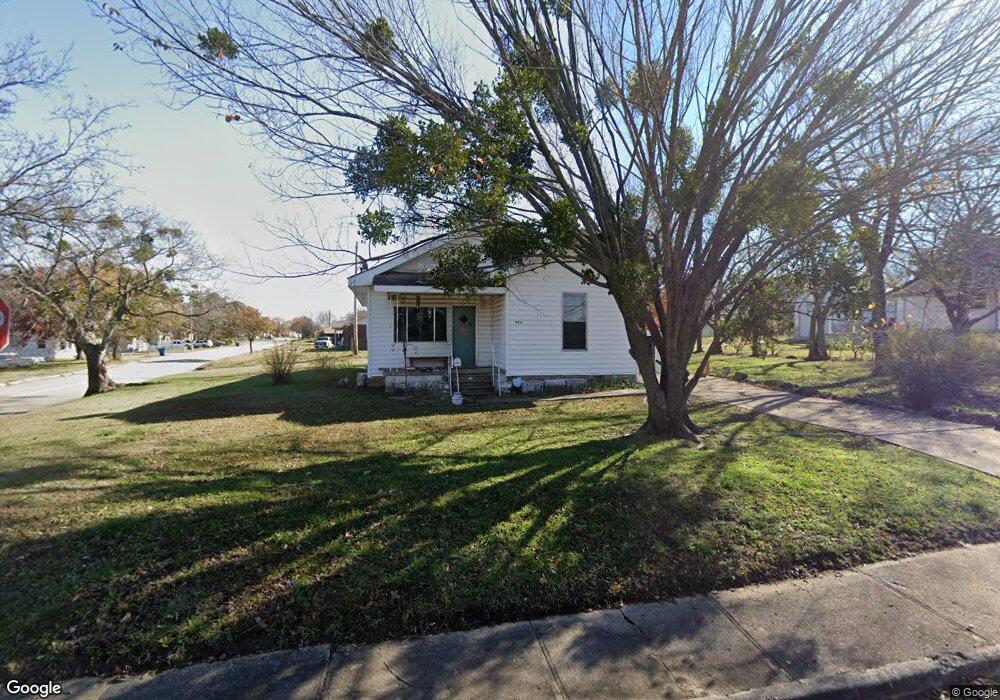
626 N F St McAlester, OK 74501
Estimated Value: $62,724 - $97,000
3
Beds
1
Bath
1,106
Sq Ft
$75/Sq Ft
Est. Value
About This Home
This home is located at 626 N F St, McAlester, OK 74501 and is currently estimated at $83,181, approximately $75 per square foot. 626 N F St is a home located in Pittsburg County with nearby schools including McAlester High School, Mcalester Christian Academy, and McAlester Christian Academy.
Create a Home Valuation Report for This Property
The Home Valuation Report is an in-depth analysis detailing your home's value as well as a comparison with similar homes in the area
Home Values in the Area
Average Home Value in this Area
Tax History Compared to Growth
Tax History
| Year | Tax Paid | Tax Assessment Tax Assessment Total Assessment is a certain percentage of the fair market value that is determined by local assessors to be the total taxable value of land and additions on the property. | Land | Improvement |
|---|---|---|---|---|
| 2025 | $222 | $3,530 | $1,048 | $2,482 |
| 2024 | $222 | $3,427 | $1,017 | $2,410 |
| 2023 | $213 | $3,328 | $967 | $2,361 |
| 2022 | $195 | $3,231 | $945 | $2,286 |
| 2021 | $194 | $3,231 | $945 | $2,286 |
| 2020 | $179 | $3,046 | $903 | $2,143 |
| 2019 | $158 | $3,045 | $907 | $2,138 |
| 2018 | $151 | $2,870 | $859 | $2,011 |
| 2017 | $146 | $2,787 | $834 | $1,953 |
| 2016 | $138 | $2,706 | $810 | $1,896 |
| 2015 | $121 | $2,627 | $513 | $2,114 |
| 2014 | $121 | $2,627 | $513 | $2,114 |
Source: Public Records
Map
Nearby Homes
- 538 W Jackson Ave
- 419 W Monroe Ave
- 609 N C St
- 603 W Jackson Ave
- 0 Monroe Rd Unit 2548049
- 611 N Hickory St
- 415 W Adams Ave
- 610 W Washington Ave
- 0 Oklahoma 31 Unit 2543194
- 209 W Jefferson Ave
- 060 Oklahoma 31
- 102 Oklahoma 31
- 101 Oklahoma 31
- 213 W Monroe Ave
- 500 W Taylor Ave
- 220 W Washington
- 200 W Polk Ave
- 204 W Washington Ave
- 509 W Cherokee Ave
- 1101 N B St