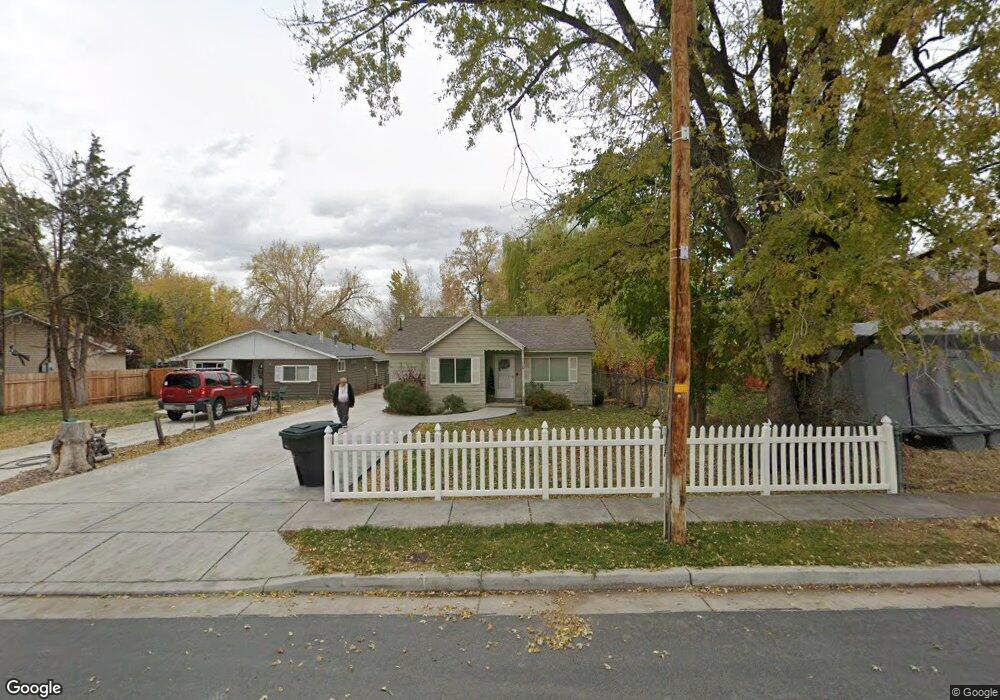
626 W Pages Ln West Bountiful, UT 84087
Estimated Value: $369,000 - $443,000
2
Beds
1
Bath
808
Sq Ft
$502/Sq Ft
Est. Value
About This Home
This home is located at 626 W Pages Ln, West Bountiful, UT 84087 and is currently estimated at $405,994, approximately $502 per square foot. 626 W Pages Ln is a home located in Davis County with nearby schools including West Bountiful Elementary School, Bountiful Junior High School, and Viewmont High School.
Ownership History
Date
Name
Owned For
Owner Type
Purchase Details
Closed on
Jun 4, 2025
Sold by
Freestone Ronald L and Freestone Peggie May
Bought by
Freestone
Current Estimated Value
Purchase Details
Closed on
Dec 16, 2011
Sold by
Rosal Jenny and Rosal David C
Bought by
Freestone Ronald and Freestone Peggie
Purchase Details
Closed on
Dec 29, 2006
Sold by
Freestone Ronald David
Bought by
Rosal David C and Rosal Jenny
Home Financials for this Owner
Home Financials are based on the most recent Mortgage that was taken out on this home.
Original Mortgage
$75,000
Interest Rate
6.22%
Mortgage Type
Purchase Money Mortgage
Purchase Details
Closed on
Aug 4, 1997
Sold by
Freestone Ronald David
Bought by
Freestone Ronald David
Home Financials for this Owner
Home Financials are based on the most recent Mortgage that was taken out on this home.
Original Mortgage
$82,500
Interest Rate
7.42%
Create a Home Valuation Report for This Property
The Home Valuation Report is an in-depth analysis detailing your home's value as well as a comparison with similar homes in the area
Home Values in the Area
Average Home Value in this Area
Purchase History
| Date | Buyer | Sale Price | Title Company |
|---|---|---|---|
| Freestone | -- | None Listed On Document | |
| Freestone Ronald | -- | None Available | |
| Rosal David C | -- | Bonneville Superior Title Co | |
| Freestone Ronald David | -- | Associated Title Company |
Source: Public Records
Mortgage History
| Date | Status | Borrower | Loan Amount |
|---|---|---|---|
| Previous Owner | Rosal David C | $75,000 | |
| Previous Owner | Freestone Ronald David | $82,500 |
Source: Public Records
Tax History Compared to Growth
Tax History
| Year | Tax Paid | Tax Assessment Tax Assessment Total Assessment is a certain percentage of the fair market value that is determined by local assessors to be the total taxable value of land and additions on the property. | Land | Improvement |
|---|---|---|---|---|
| 2025 | $2,251 | $178,750 | $120,491 | $58,259 |
| 2024 | $2,168 | $175,999 | $99,331 | $76,668 |
| 2023 | $2,138 | $175,450 | $127,975 | $47,474 |
| 2022 | $2,150 | $328,000 | $206,111 | $121,889 |
| 2021 | $1,982 | $254,000 | $156,229 | $97,771 |
| 2020 | $1,673 | $208,000 | $143,385 | $64,615 |
| 2019 | $1,689 | $210,000 | $142,452 | $67,548 |
| 2018 | $1,518 | $184,000 | $139,295 | $44,705 |
| 2016 | $1,363 | $89,870 | $39,777 | $50,093 |
| 2015 | $1,312 | $81,400 | $39,777 | $41,623 |
| 2014 | $1,154 | $71,860 | $39,777 | $32,083 |
| 2013 | -- | $73,342 | $34,597 | $38,745 |
Source: Public Records
Map
Nearby Homes
- 637 W 1600 N
- 789 W 1950 N
- Lincoln Farmhouse Plan at Belmont Farms
- Belmont Traditional Plan at Belmont Farms
- Hampton Traditional Plan at Belmont Farms
- 580 W 2125 N
- 1503 N 300 W
- 825 W 1320 N
- 2035 N 800 W
- 239 Lyman Ln
- 234 Leah Cir
- 215 Lyman Ln
- 204 Lyman Ln
- 235 W 1400 N
- 1552 N 200 W
- 366 W 1000 N
- 2257 N 830 W
- 1410 N 200 W
- 420 Rawlins Cir
- 2339 N 800 W