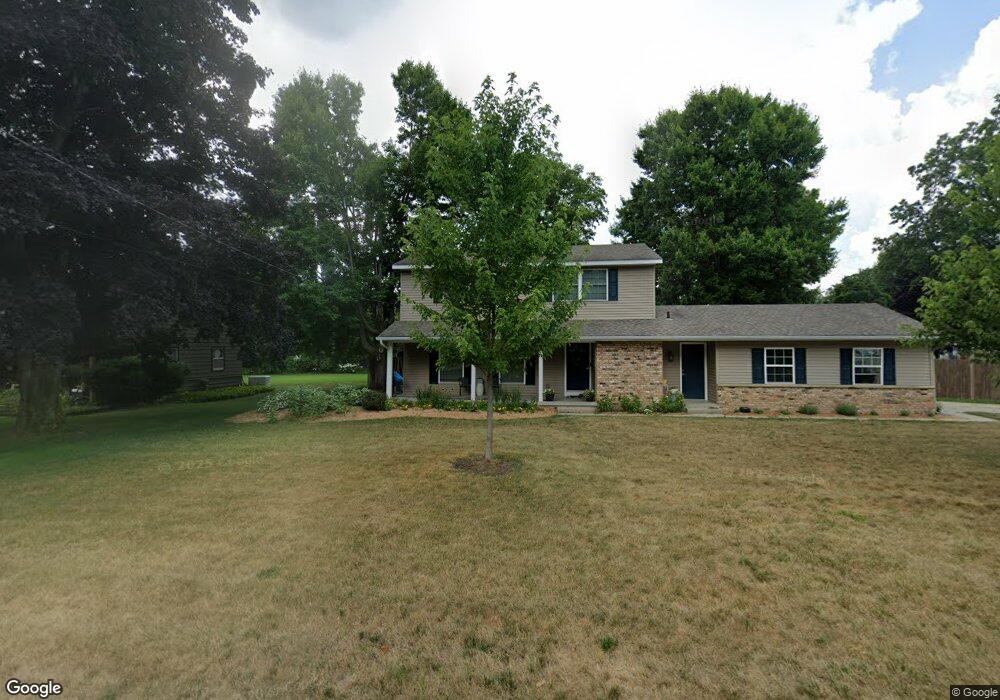
6261 Archer St NE Rockford, MI 49341
Estimated Value: $409,000 - $471,000
4
Beds
2
Baths
2,403
Sq Ft
$184/Sq Ft
Est. Value
About This Home
This home is located at 6261 Archer St NE, Rockford, MI 49341 and is currently estimated at $443,325, approximately $184 per square foot. 6261 Archer St NE is a home located in Kent County with nearby schools including North Rockford Middle School, Rockford High School, and Rockford High School Freshman Center.
Ownership History
Date
Name
Owned For
Owner Type
Purchase Details
Closed on
Jun 22, 2010
Sold by
Federal Home Loan Mortgage Corporation
Bought by
Bergsma Joseph and Bergsma Angela
Current Estimated Value
Home Financials for this Owner
Home Financials are based on the most recent Mortgage that was taken out on this home.
Original Mortgage
$107,825
Outstanding Balance
$71,552
Interest Rate
4.77%
Mortgage Type
New Conventional
Estimated Equity
$371,773
Purchase Details
Closed on
Jul 15, 2009
Sold by
Creasey Paul J and Creasey Paul J
Bought by
Federal Home Loan Mortgage Corp
Purchase Details
Closed on
Mar 16, 1998
Sold by
Connely Gary Allen
Bought by
Creasey Paul J and Bergsma Joseph
Purchase Details
Closed on
May 29, 1992
Sold by
Macrea Richard A and Macrea Bridget A
Bought by
Connely Gary Allen and Connely Brenda S
Purchase Details
Closed on
Apr 27, 1989
Sold by
Kitson Gerald L and Kitson Karen K
Bought by
Macrea Richard A and Macrea Bridget A
Create a Home Valuation Report for This Property
The Home Valuation Report is an in-depth analysis detailing your home's value as well as a comparison with similar homes in the area
Home Values in the Area
Average Home Value in this Area
Purchase History
| Date | Buyer | Sale Price | Title Company |
|---|---|---|---|
| Bergsma Joseph | $114,650 | Attorneys Title Agency Llc | |
| Federal Home Loan Mortgage Corp | $113,717 | None Available | |
| Creasey Paul J | $154,000 | -- | |
| Connely Gary Allen | $133,500 | -- | |
| Macrea Richard A | $110,000 | -- |
Source: Public Records
Mortgage History
| Date | Status | Borrower | Loan Amount |
|---|---|---|---|
| Open | Bergsma Joseph | $107,825 |
Source: Public Records
Tax History Compared to Growth
Tax History
| Year | Tax Paid | Tax Assessment Tax Assessment Total Assessment is a certain percentage of the fair market value that is determined by local assessors to be the total taxable value of land and additions on the property. | Land | Improvement |
|---|---|---|---|---|
| 2025 | $4,362 | $217,300 | $0 | $0 |
| 2024 | $4,362 | $204,000 | $0 | $0 |
| 2023 | $2,124 | $160,700 | $0 | $0 |
| 2022 | $1,090 | $148,700 | $0 | $0 |
| 2021 | $3,031 | $135,400 | $0 | $0 |
| 2020 | $1,956 | $122,700 | $0 | $0 |
| 2019 | $2,960 | $116,700 | $0 | $0 |
| 2018 | $2,985 | $114,400 | $0 | $0 |
| 2017 | $2,907 | $105,100 | $0 | $0 |
| 2016 | $2,810 | $92,200 | $0 | $0 |
| 2015 | $2,724 | $92,200 | $0 | $0 |
| 2013 | -- | $82,500 | $0 | $0 |
Source: Public Records
Map
Nearby Homes
- 6551 Kuttshill Dr NE
- 3793 Windsor Ridge Dr NE
- 3791 Windsor Ridge Dr NE
- 6598 Timber Crest Dr NE
- Norwood Plan at Ravines at Inwood - The Villas at the Ravines
- Croswell Plan at Ravines at Inwood
- Pentwater Plan at Ravines at Inwood - Landmark Series
- Encore Plan at Ravines at Inwood - The Villas at the Ravines
- Avery Plan at Ravines at Inwood
- Carson Plan at Ravines at Inwood
- Elmwood Plan at Ravines at Inwood - Woodland Series
- Sycamore Plan at Ravines at Inwood - Woodland Series
- Maplewood Plan at Ravines at Inwood - Woodland Series
- Bay Harbor Plan at Ravines at Inwood - Landmark Series
- Redwood Plan at Ravines at Inwood - Woodland Series
- Camden Plan at Ravines at Inwood - Cottage Series
- Cascade Plan at Ravines at Inwood
- Remington Plan at Ravines at Inwood
- Sterling Plan at Ravines at Inwood - The Villas at the Ravines
- Carrington Plan at Ravines at Inwood - The Villas at the Ravines
- 6261 Archer Ave NE
- 6243 Archer St NE
- 3474 Knollwood St NE
- 3493 Knollwood St NE
- 6262 Archer Ave NE
- 6229 Archer Ave NE
- 6229 Archer St NE
- 3479 Knollwood St NE
- 6262 Archer St NE
- 3471 Thistle Dhu Dr NE
- 6244 Archer St NE
- 3458 Knollwood St NE
- 3507 Knollwood St NE
- 6230 Archer Ave NE
- 6276 Archer St NE
- 3463 Knollwood St NE
- 6230 Archer St NE
- 6230 Archer St NE
- 3455 Thistle Dhu Dr NE
- 3486 Gateshead St NE