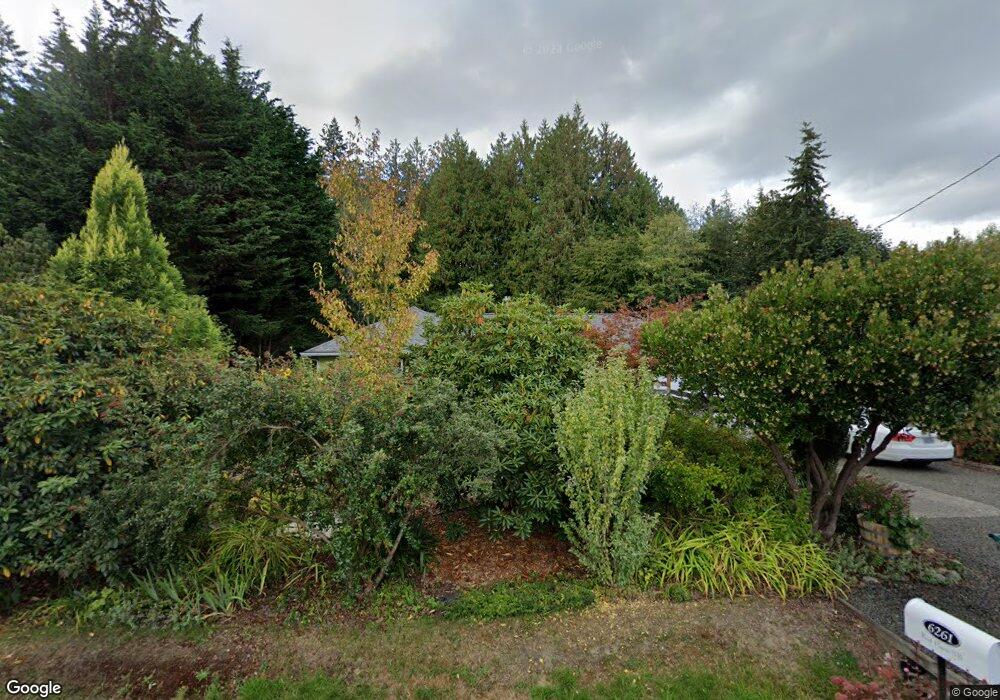
6261 Rest Place NE Bremerton, WA 98311
Estimated Value: $433,941 - $462,000
3
Beds
1
Bath
1,330
Sq Ft
$340/Sq Ft
Est. Value
About This Home
This home is located at 6261 Rest Place NE, Bremerton, WA 98311 and is currently estimated at $452,485, approximately $340 per square foot. 6261 Rest Place NE is a home located in Kitsap County with nearby schools including View Ridge Elementary School, Mountain View Middle School, and Bremerton High School.
Ownership History
Date
Name
Owned For
Owner Type
Purchase Details
Closed on
Sep 25, 2008
Sold by
Haver Richard G and Haver Stephanie A
Bought by
Collier Marcus G and Collier Lisa Kay
Current Estimated Value
Home Financials for this Owner
Home Financials are based on the most recent Mortgage that was taken out on this home.
Original Mortgage
$207,000
Outstanding Balance
$138,046
Interest Rate
6.49%
Mortgage Type
Unknown
Estimated Equity
$314,439
Purchase Details
Closed on
Aug 6, 2004
Sold by
Knudtzon Judith L and Banks Steven G
Bought by
Haver Richard G and Haver Stephanie A
Home Financials for this Owner
Home Financials are based on the most recent Mortgage that was taken out on this home.
Original Mortgage
$186,300
Interest Rate
6.17%
Mortgage Type
VA
Create a Home Valuation Report for This Property
The Home Valuation Report is an in-depth analysis detailing your home's value as well as a comparison with similar homes in the area
Home Values in the Area
Average Home Value in this Area
Purchase History
| Date | Buyer | Sale Price | Title Company |
|---|---|---|---|
| Collier Marcus G | $230,280 | Rainier Title Co | |
| Haver Richard G | $182,300 | Transnation Title |
Source: Public Records
Mortgage History
| Date | Status | Borrower | Loan Amount |
|---|---|---|---|
| Open | Collier Marcus G | $207,000 | |
| Previous Owner | Haver Richard G | $186,300 |
Source: Public Records
Tax History Compared to Growth
Tax History
| Year | Tax Paid | Tax Assessment Tax Assessment Total Assessment is a certain percentage of the fair market value that is determined by local assessors to be the total taxable value of land and additions on the property. | Land | Improvement |
|---|---|---|---|---|
| 2026 | $3,478 | $349,050 | $128,260 | $220,790 |
| 2025 | $3,478 | $349,050 | $128,260 | $220,790 |
| 2024 | $3,360 | $349,050 | $128,260 | $220,790 |
| 2023 | $3,369 | $349,050 | $128,260 | $220,790 |
| 2022 | $3,156 | $289,070 | $106,000 | $183,070 |
| 2021 | $3,030 | $260,710 | $78,870 | $181,840 |
| 2020 | $2,772 | $246,270 | $74,420 | $171,850 |
| 2019 | $2,521 | $222,060 | $67,200 | $154,860 |
| 2018 | $2,771 | $184,420 | $55,540 | $128,880 |
| 2017 | $2,507 | $184,420 | $55,540 | $128,880 |
| 2016 | $2,371 | $165,490 | $49,590 | $115,900 |
| 2015 | $2,182 | $155,760 | $54,940 | $100,820 |
| 2014 | -- | $149,210 | $54,940 | $94,270 |
| 2013 | -- | $149,210 | $54,940 | $94,270 |
Source: Public Records
Map
Nearby Homes
- 6305 Rest Place NE
- 3532 NE Shore Cliff St
- 3380 NE 3rd St N Unit 29
- 3744 NE Trout Brook Ln
- 3060 NE Mcwilliams Rd Unit 104
- 3060 NE Mcwilliams Rd Unit 9
- 4005 NE Derek Dr
- 3840 NE Ambleside Ln
- 3703 NE Trout Brook Ln
- 5503 Fern Ave NE
- 3 Illahee Rd NE
- 2940 Osiris Ct NE
- 3709 NE Liverpool Dr
- 5208 Illahee Rd NE
- 2348 NE Windsor Ct
- 7265 Thasos Ave NE
- 0 University Point Cir NE
- 7550 Varsity Ln NE
- 4808 Charmont Ln NE
- 2112 NE Lexington Dr
- 6267 Rest Place NE
- 6107 Rest Place NE
- 6273 Rest Place NE
- 0 Off- Sunset Ave Unit 681112
- 6279 Rest Place NE
- 3350 NE 1st St
- 3337 NE Mcwilliams Rd
- 6149 East Blvd NE
- 3532 NE 1st St
- 3312 NE 1st St
- 6291 Rest Place NE
- 6285 Rest Place NE
- 3536 NE 1st St
- 3325 NE Mcwilliams Rd
- 3340 NE 1st St
- 6147 East Blvd NE
- 6253 East Blvd NE
- 6251 East Blvd NE
- 3343 NE 1st St
- 6088 Rest Place NE