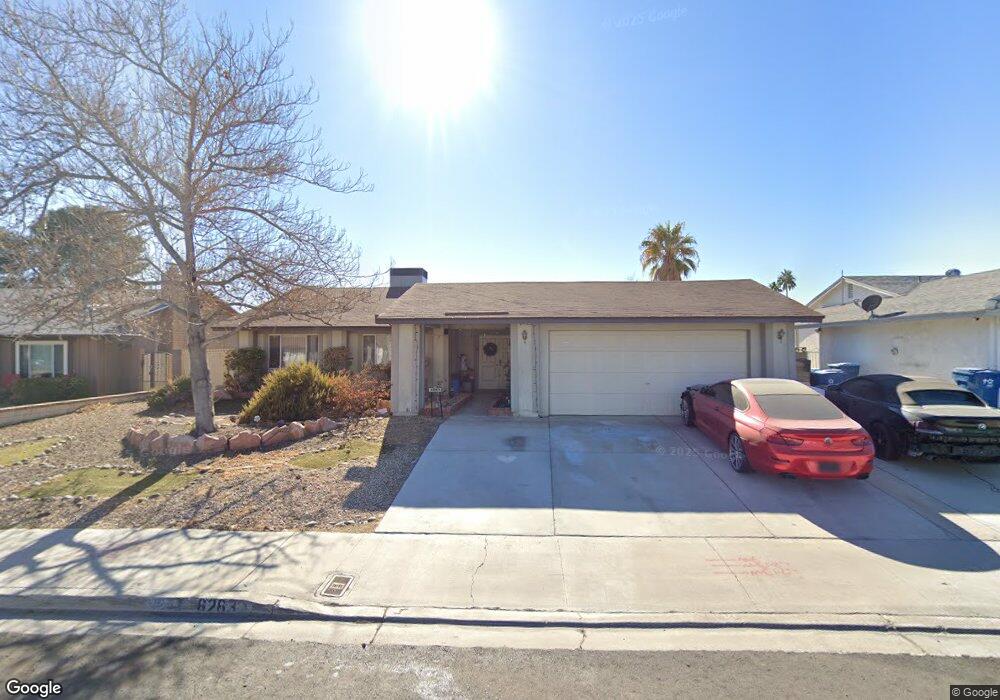
6263 Elmira Dr Unit 4 Las Vegas, NV 89118
Estimated Value: $421,526 - $428,000
3
Beds
2
Baths
1,438
Sq Ft
$295/Sq Ft
Est. Value
About This Home
This home is located at 6263 Elmira Dr Unit 4, Las Vegas, NV 89118 and is currently estimated at $424,382, approximately $295 per square foot. 6263 Elmira Dr Unit 4 is a home located in Clark County with nearby schools including Marion B Earl Elementary School, Grant Sawyer Middle School, and Durango High School.
Ownership History
Date
Name
Owned For
Owner Type
Purchase Details
Closed on
Jun 25, 2002
Sold by
Ramsey Kevin H and Ramsey Tammi J
Bought by
Beadel Darrick B
Current Estimated Value
Home Financials for this Owner
Home Financials are based on the most recent Mortgage that was taken out on this home.
Original Mortgage
$128,000
Interest Rate
7.25%
Purchase Details
Closed on
Feb 22, 2000
Sold by
Sparks Perry and Sparks Catherine
Bought by
Ramsey Kevin H and Ramsey Tammi J
Home Financials for this Owner
Home Financials are based on the most recent Mortgage that was taken out on this home.
Original Mortgage
$112,400
Interest Rate
9.62%
Purchase Details
Closed on
Nov 12, 1999
Sold by
Anderson Fred Douglas and Anderson Montyne
Bought by
Sparks Perry and Sparks Catherine
Home Financials for this Owner
Home Financials are based on the most recent Mortgage that was taken out on this home.
Original Mortgage
$90,000
Interest Rate
7.84%
Create a Home Valuation Report for This Property
The Home Valuation Report is an in-depth analysis detailing your home's value as well as a comparison with similar homes in the area
Home Values in the Area
Average Home Value in this Area
Purchase History
| Date | Buyer | Sale Price | Title Company |
|---|---|---|---|
| Beadel Darrick B | $160,000 | Old Republic Title Company | |
| Ramsey Kevin H | $140,500 | Old Republic Title Company | |
| Sparks Perry | $112,500 | Old Republic Title Company |
Source: Public Records
Mortgage History
| Date | Status | Borrower | Loan Amount |
|---|---|---|---|
| Previous Owner | Beadel Darrick B | $128,000 | |
| Previous Owner | Ramsey Kevin H | $112,400 | |
| Previous Owner | Sparks Perry | $90,000 | |
| Closed | Ramsey Kevin H | $28,100 | |
| Closed | Beadel Darrick B | $32,000 |
Source: Public Records
Tax History Compared to Growth
Tax History
| Year | Tax Paid | Tax Assessment Tax Assessment Total Assessment is a certain percentage of the fair market value that is determined by local assessors to be the total taxable value of land and additions on the property. | Land | Improvement |
|---|---|---|---|---|
| 2025 | $1,947 | $74,285 | $37,800 | $36,485 |
| 2024 | $1,797 | $74,285 | $37,800 | $36,485 |
| 2023 | $1,797 | $71,048 | $35,000 | $36,048 |
| 2022 | $1,677 | $63,637 | $29,750 | $33,887 |
| 2021 | $1,541 | $58,063 | $25,200 | $32,863 |
| 2020 | $1,428 | $58,453 | $25,200 | $33,253 |
| 2019 | $1,338 | $54,399 | $21,000 | $33,399 |
| 2018 | $1,277 | $53,819 | $21,000 | $32,819 |
| 2017 | $1,529 | $52,120 | $18,200 | $33,920 |
| 2016 | $1,196 | $47,470 | $12,600 | $34,870 |
| 2015 | $1,193 | $46,870 | $12,250 | $34,620 |
| 2014 | $1,158 | $40,967 | $8,750 | $32,217 |
Source: Public Records
Map
Nearby Homes
- 6358 Elmira Dr
- 5195 Sepulveda Blvd
- 6428 Crystal Dew Dr
- 5255 Autumn Sky Rd
- 5263 Autumn Sky Rd
- 5410 Manteca Cir
- 5170 S Jones Blvd Unit 108
- 5166 S Jones Blvd Unit 101
- 5166 S Jones Blvd Unit 205
- 6078 Sunken River Trail
- 5162 S Jones Blvd Unit 103
- 5158 S Jones Blvd Unit 201
- 5158 S Jones Blvd Unit 208
- 5201 S Torrey Pines Dr Unit 1227
- 5201 S Torrey Pines Dr Unit 1253
- 5240 Island Chain Rd
- 5000 Red Rock St Unit 105
- 5000 Red Rock St Unit 248
- 5000 Red Rock St Unit 259
- 5000 Red Rock St Unit 237
- 6273 Elmira Dr
- 6255 Elmira Dr
- 6262 Brea Blvd
- 6272 Brea Blvd
- 6254 Brea Blvd
- 6283 Elmira Dr
- 6245 Elmira Dr
- 6262 Elmira Dr
- 6262 Elmira Dr Unit n/a
- 6272 Elmira Dr Unit 4
- 6282 Brea Blvd
- 6254 Elmira Dr
- 6244 Brea Blvd
- 6280 Elmira Dr
- 6292 Brea Blvd
- 6293 Elmira Dr
- 6244 Elmira Dr Unit 4
- 6290 Elmira Dr
- 6261 La Palma Pkwy
- 6253 La Palma Pkwy