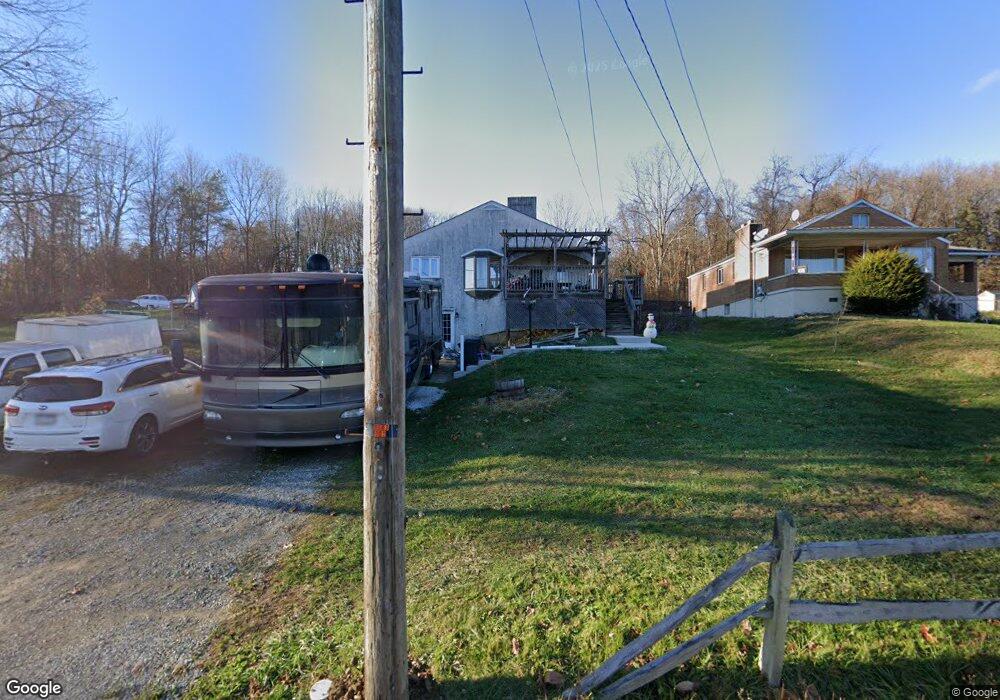
6264 Claridge Export Rd Claridge, PA 15623
Penn Township NeighborhoodEstimated Value: $131,000 - $271,000
--
Bed
--
Bath
1,055
Sq Ft
$210/Sq Ft
Est. Value
About This Home
This home is located at 6264 Claridge Export Rd, Claridge, PA 15623 and is currently estimated at $221,333, approximately $209 per square foot. 6264 Claridge Export Rd is a home located in Westmoreland County with nearby schools including Penn Trafford High School.
Ownership History
Date
Name
Owned For
Owner Type
Purchase Details
Closed on
Apr 11, 2016
Sold by
Baker James M and Baker Janine T
Bought by
Baker James M and Baker Janine T
Current Estimated Value
Home Financials for this Owner
Home Financials are based on the most recent Mortgage that was taken out on this home.
Original Mortgage
$138,380
Outstanding Balance
$109,281
Interest Rate
3.5%
Mortgage Type
FHA
Estimated Equity
$112,052
Purchase Details
Closed on
Apr 11, 2008
Sold by
Kerr Jeffrey D and Kerr Susan E
Bought by
Baker James M
Home Financials for this Owner
Home Financials are based on the most recent Mortgage that was taken out on this home.
Original Mortgage
$103,377
Interest Rate
6.22%
Mortgage Type
Purchase Money Mortgage
Create a Home Valuation Report for This Property
The Home Valuation Report is an in-depth analysis detailing your home's value as well as a comparison with similar homes in the area
Home Values in the Area
Average Home Value in this Area
Purchase History
| Date | Buyer | Sale Price | Title Company |
|---|---|---|---|
| Baker James M | -- | None Available | |
| Baker James M | $105,000 | None Available |
Source: Public Records
Mortgage History
| Date | Status | Borrower | Loan Amount |
|---|---|---|---|
| Open | Baker James M | $138,380 | |
| Closed | Baker James M | $103,377 |
Source: Public Records
Tax History Compared to Growth
Tax History
| Year | Tax Paid | Tax Assessment Tax Assessment Total Assessment is a certain percentage of the fair market value that is determined by local assessors to be the total taxable value of land and additions on the property. | Land | Improvement |
|---|---|---|---|---|
| 2025 | $1,935 | $14,130 | $2,140 | $11,990 |
| 2024 | $1,921 | $14,130 | $2,140 | $11,990 |
| 2023 | $1,822 | $14,130 | $2,140 | $11,990 |
| 2022 | $1,801 | $14,130 | $2,140 | $11,990 |
| 2021 | $1,787 | $14,130 | $2,140 | $11,990 |
| 2020 | $1,772 | $14,130 | $2,140 | $11,990 |
| 2019 | $1,730 | $14,130 | $2,140 | $11,990 |
| 2018 | $1,681 | $14,130 | $2,140 | $11,990 |
| 2017 | $1,638 | $14,130 | $2,140 | $11,990 |
| 2016 | $1,490 | $14,130 | $2,140 | $11,990 |
| 2015 | $1,444 | $12,830 | $2,140 | $10,690 |
| 2014 | $1,418 | $12,830 | $2,140 | $10,690 |
Source: Public Records
Map
Nearby Homes
- 3168 Main St
- 2002 Callaway Dr
- 5004 Wellington Ct
- 2211 Newton St
- 2033 Bushy Run Rd
- 2052 Main St
- 000 Harrold St
- Thornewood w/ Finished Basement Plan at Wellington
- 1004 Deveron Ct
- 3005 Wellington Ct
- 5004 Wellington Ct
- 4003 Trail Side Ct Unit B
- 1007 Wellington Ct
- 5006 Wellington Ct
- 6002 Wellington Ct
- 2003 Trail Side Ct Unit B
- 49 Nancy Dr
- 6014 Brookside Dr
- 2052 Ridge Rd
- 114 Adella Ct
- 6266 Claridge Export Rd
- 6265 Claridge Export Rd
- 6244 Claridge Export Rd
- 3010 Claridge Export Rd
- 6270 Claridge Export Rd
- 4037 Sr
- 6261 Claridge Export Rd
- 6261 Claridge Export Rd
- 6274 Claridge Export Rd
- 6275 Claridge Export Rd
- 3003 Claridge Export Rd
- 3212 Main St
- 3201 Saint John St
- 6279 Claridge Export Rd
- 3002 Claridge Export Rd
- 3114 Claridge Export Rd
- 3203 Saint John St
- 3218 Main St
- 211 Main St
- 2129 Claridge Elliott Rd