6264 Stoney Austell, GA 30168
Estimated Value: $273,000 - $316,000
3
Beds
2
Baths
1,418
Sq Ft
$202/Sq Ft
Est. Value
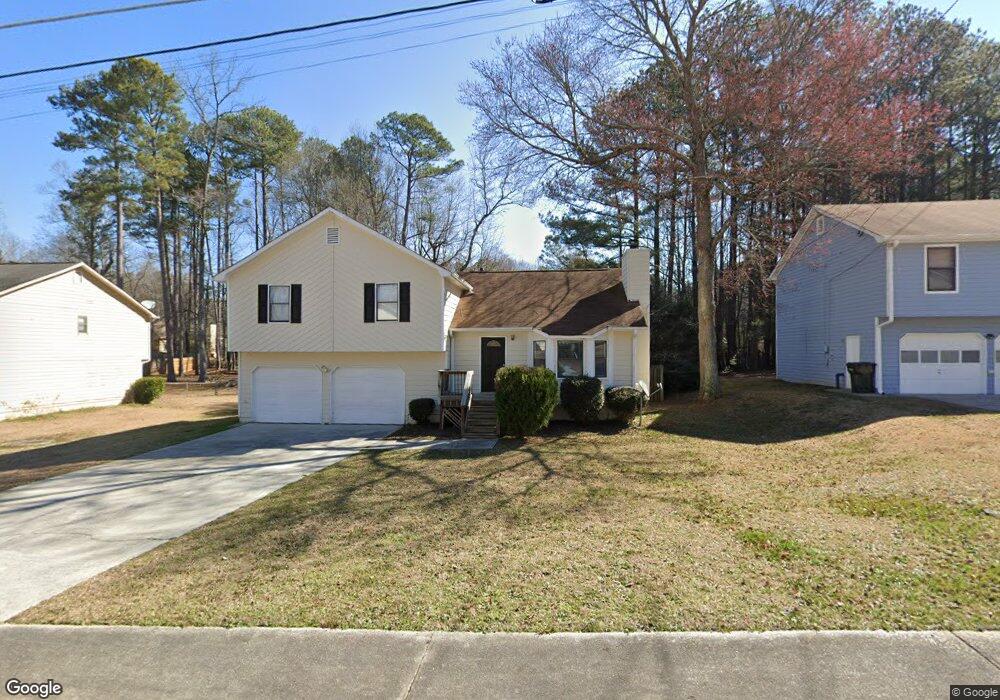
About This Home
This home is located at 6264 Stoney, Austell, GA 30168 and is currently estimated at $286,467, approximately $202 per square foot. 6264 Stoney is a home located in Cobb County with nearby schools including Bryant Elementary School, Lindley Middle School, and Pebblebrook High School.
Ownership History
Date
Name
Owned For
Owner Type
Purchase Details
Closed on
Aug 23, 2023
Sold by
Mission Street Homes Llc
Bought by
Ofosu-Ampofo Veronica P and Dery Francis
Current Estimated Value
Home Financials for this Owner
Home Financials are based on the most recent Mortgage that was taken out on this home.
Original Mortgage
$270,775
Outstanding Balance
$264,775
Interest Rate
6.96%
Mortgage Type
New Conventional
Estimated Equity
$21,692
Purchase Details
Closed on
Aug 27, 2021
Sold by
Chevere Ralston Brandi L and Chevere Ralston Yanira
Bought by
Divvy Homes Warehouse A Llc
Purchase Details
Closed on
Mar 8, 2017
Sold by
Chevere-Ralston Brandi L
Bought by
Chevere Ralston Brandi L and Chevere Ralston Yanira
Purchase Details
Closed on
May 11, 2004
Sold by
Alexander Danny K and Alexander Gwendolyn J
Bought by
Parkerson Hal B and Parkerson Ellen
Create a Home Valuation Report for This Property
The Home Valuation Report is an in-depth analysis detailing your home's value as well as a comparison with similar homes in the area
Home Values in the Area
Average Home Value in this Area
Purchase History
| Date | Buyer | Sale Price | Title Company |
|---|---|---|---|
| Ofosu-Ampofo Veronica P | $279,200 | None Listed On Document | |
| Divvy Homes Warehouse A Llc | $215,000 | None Available | |
| Chevere Ralston Brandi L | -- | -- | |
| Parkerson Hal B | $105,000 | -- |
Source: Public Records
Mortgage History
| Date | Status | Borrower | Loan Amount |
|---|---|---|---|
| Open | Ofosu-Ampofo Veronica P | $270,775 |
Source: Public Records
Tax History Compared to Growth
Tax History
| Year | Tax Paid | Tax Assessment Tax Assessment Total Assessment is a certain percentage of the fair market value that is determined by local assessors to be the total taxable value of land and additions on the property. | Land | Improvement |
|---|---|---|---|---|
| 2025 | $3,364 | $111,640 | $19,920 | $91,720 |
| 2024 | $3,366 | $111,640 | $19,920 | $91,720 |
| 2023 | $3,251 | $107,836 | $20,000 | $87,836 |
| 2022 | $2,503 | $82,476 | $13,600 | $68,876 |
| 2021 | $2,503 | $82,476 | $13,600 | $68,876 |
| 2020 | $1,689 | $55,652 | $7,200 | $48,452 |
| 2019 | $1,689 | $55,652 | $7,200 | $48,452 |
| 2018 | $1,113 | $36,660 | $6,000 | $30,660 |
| 2017 | $797 | $36,660 | $6,000 | $30,660 |
| 2016 | $540 | $27,684 | $4,000 | $23,684 |
| 2015 | $555 | $27,684 | $4,000 | $23,684 |
| 2014 | $212 | $15,972 | $0 | $0 |
Source: Public Records
Map
Nearby Homes
- 7098 Pleasant Dr
- 7067 Pleasant Dr
- 7063 Pleasant Dr
- 1243 Blairs Pointe Dr Unit 3
- 1195 Park Center Cir
- 1199 Park Center Cir
- 1203 Park Center Cir
- 7254 Silverton Trail
- 00 Hembree Ln
- 0 Hembree Ln Unit 10633605
- 1186 Park Center Cir
- 1182 Park Center Cir
- 1163 Park Center Cir
- 1142 Hembree Ln
- 1211 Ling Way
- Redbud-Townhome Plan at Park Center Pointe - Hometown Series
- Bayberry-Townhome Plan at Park Center Pointe - Hometown Series
- 1311 Park Center Cir
- 2253 Ponder Way
- 2965 Bancroft L Grafton
- 7063 Siver Bend Overlook Rd
- 3 Lots at Factory Shoals Rd
- 000 ****Test*** Bluffs
- 2 Mountain View Rd
- 3 Mountain View Rd
- 7258 Trail
- 0 Cedar Mountain Unit 8929192
- 6566 Misty Glen
- 6181 Grove Way
- 000 Six Flags Pkwy
- 0 Six Flags Pkwy Unit 2842763
- 0 Six Flags Rd Unit 8089495
- 0 Six Flags Pkwy Unit 7449246
- 0 Six Flags Pkwy Unit 5535459
- 0000 Austell Rd
- 1333 Lake Cir
- 1194 Flamingo Dr
- 1192 Flamingo Dr