6265 Catskill Ln Colorado Springs, CO 80918
Norwood NeighborhoodEstimated Value: $416,599 - $456,000
4
Beds
3
Baths
1,318
Sq Ft
$331/Sq Ft
Est. Value
About This Home
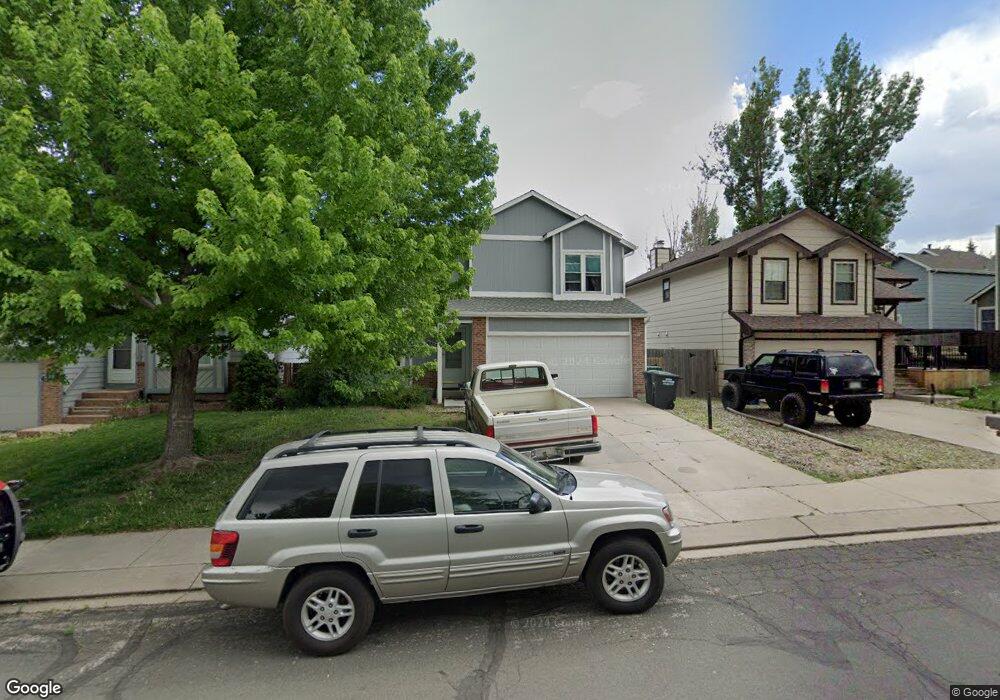
This home is located at 6265 Catskill Ln, Colorado Springs, CO 80918 and is currently estimated at $436,650, approximately $331 per square foot. 6265 Catskill Ln is a home located in El Paso County with nearby schools including Martinez Elementary School, Jenkins Middle School, and Doherty High School.
Ownership History
Date
Name
Owned For
Owner Type
Purchase Details
Closed on
May 25, 2005
Sold by
Hadden Stephen P and Hadden Nancy E
Bought by
Harper Andre and Harper Krista L
Current Estimated Value
Home Financials for this Owner
Home Financials are based on the most recent Mortgage that was taken out on this home.
Original Mortgage
$147,600
Outstanding Balance
$76,910
Interest Rate
5.83%
Mortgage Type
Fannie Mae Freddie Mac
Estimated Equity
$359,740
Purchase Details
Closed on
Sep 30, 1999
Sold by
Spieker Jon L and Spieker Faye E
Bought by
Hadden Stephen P and Hadden Nancy E
Home Financials for this Owner
Home Financials are based on the most recent Mortgage that was taken out on this home.
Original Mortgage
$96,000
Interest Rate
8.02%
Purchase Details
Closed on
Nov 20, 1991
Bought by
Harper Krista L
Purchase Details
Closed on
Nov 14, 1988
Bought by
Harper Krista L
Create a Home Valuation Report for This Property
The Home Valuation Report is an in-depth analysis detailing your home's value as well as a comparison with similar homes in the area
Home Values in the Area
Average Home Value in this Area
Purchase History
| Date | Buyer | Sale Price | Title Company |
|---|---|---|---|
| Harper Andre | $184,500 | Security Title | |
| Hadden Stephen P | $120,000 | North American Title Co | |
| Harper Krista L | $80,600 | -- | |
| Harper Krista L | -- | -- |
Source: Public Records
Mortgage History
| Date | Status | Borrower | Loan Amount |
|---|---|---|---|
| Open | Harper Andre | $147,600 | |
| Previous Owner | Hadden Stephen P | $96,000 | |
| Closed | Hadden Stephen P | $18,000 |
Source: Public Records
Tax History Compared to Growth
Tax History
| Year | Tax Paid | Tax Assessment Tax Assessment Total Assessment is a certain percentage of the fair market value that is determined by local assessors to be the total taxable value of land and additions on the property. | Land | Improvement |
|---|---|---|---|---|
| 2025 | $1,426 | $28,390 | -- | -- |
| 2024 | $1,313 | $28,320 | $5,700 | $22,620 |
| 2023 | $1,313 | $28,320 | $5,700 | $22,620 |
| 2022 | $1,257 | $20,980 | $5,060 | $15,920 |
| 2021 | $1,359 | $21,590 | $5,210 | $16,380 |
| 2020 | $1,323 | $18,430 | $4,530 | $13,900 |
| 2019 | $1,317 | $18,430 | $4,530 | $13,900 |
| 2018 | $1,218 | $15,750 | $3,810 | $11,940 |
| 2017 | $1,157 | $15,750 | $3,810 | $11,940 |
| 2016 | $932 | $15,050 | $3,940 | $11,110 |
| 2015 | $928 | $15,050 | $3,940 | $11,110 |
| 2014 | $893 | $13,930 | $3,890 | $10,040 |
Source: Public Records
Map
Nearby Homes
- 6030 Barnacle Ct
- 4265 Dolphin Cir
- 3887 Point of the Rocks Dr
- 3840 Summer Breeze Dr
- 3716 Adirondack Dr
- 6125 Northwind Dr
- 4224 Mesa Overlook Point
- 4217 High Timberline View
- 3928 Diamond Ridge View
- 6463 Bluffmont Point
- 4229 High Timberline View
- 3550 Summer Breeze Dr
- 6103 Treeledge Dr
- 6565 Baytree Grove
- 5904 Mapleton Dr
- 3613 Summer Breeze Dr
- 5745 Doe Skin Ct
- 5978 Maroon Mesa Dr
- 6515 Medicine Springs Dr
- 3520 Lost Hills Ct
- 6275 Catskill Ln
- 6255 Catskill Ln
- 6285 Catskill Ln
- 4120 Kayak Ct
- 4020 Dolphin Cir
- 4010 Dolphin Cir
- 4030 Dolphin Cir
- 6295 Catskill Ln
- 4110 Kayak Ct
- 4130 Kayak Ct
- 3997 Topsail Dr
- 4040 Dolphin Cir
- 6315 Catskill Ln
- 4050 Dolphin Cir
- 4140 Kayak Ct
- 3993 Topsail Dr
- 4125 Kayak Ct
- 3998 Topsail Dr
- 4060 Dolphin Cir
- 6325 Catskill Ln