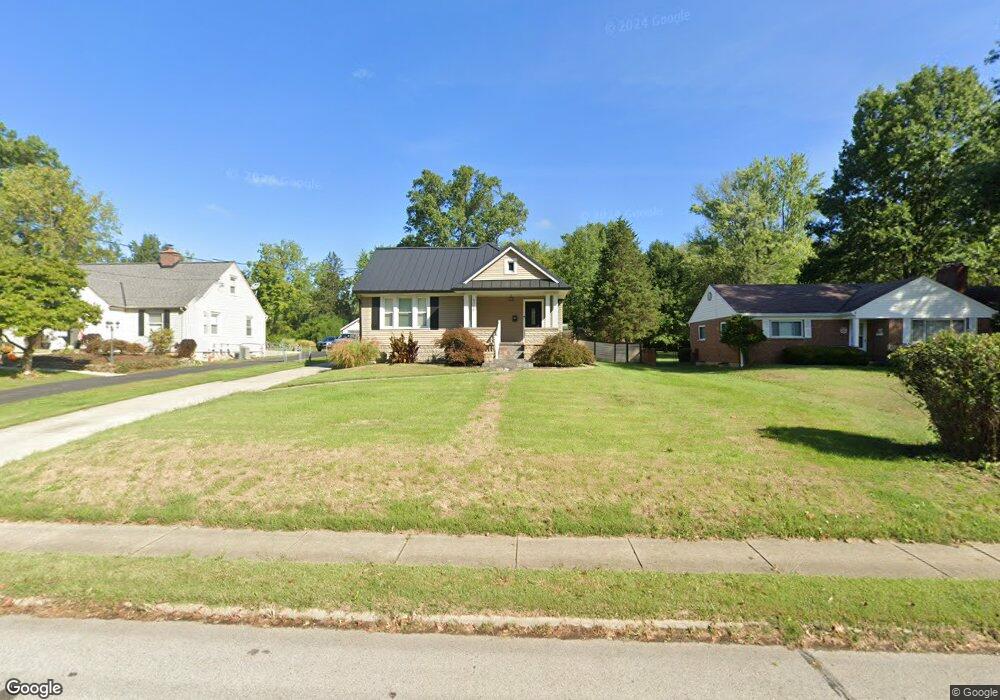
6268 Salem Rd Cincinnati, OH 45230
Salem Heights NeighborhoodEstimated Value: $313,000 - $449,000
3
Beds
2
Baths
1,829
Sq Ft
$202/Sq Ft
Est. Value
About This Home
This home is located at 6268 Salem Rd, Cincinnati, OH 45230 and is currently estimated at $368,797, approximately $201 per square foot. 6268 Salem Rd is a home located in Hamilton County with nearby schools including Maddux Elementary School, Nagel Middle School, and Anderson High School.
Ownership History
Date
Name
Owned For
Owner Type
Purchase Details
Closed on
Oct 27, 2009
Sold by
Secretary Of Housing & Urban Developmen
Bought by
Clemons Stephanie A
Current Estimated Value
Home Financials for this Owner
Home Financials are based on the most recent Mortgage that was taken out on this home.
Original Mortgage
$76,000
Outstanding Balance
$49,096
Interest Rate
5.11%
Mortgage Type
New Conventional
Estimated Equity
$319,701
Purchase Details
Closed on
Jul 7, 2008
Sold by
Scott Sandra and Scott Charles
Bought by
Suntrust Mortgage Inc
Purchase Details
Closed on
Jul 25, 2000
Sold by
Imogene Cook Helen
Bought by
Scott Charles and Scott Sandra
Home Financials for this Owner
Home Financials are based on the most recent Mortgage that was taken out on this home.
Original Mortgage
$126,800
Interest Rate
8.16%
Mortgage Type
FHA
Create a Home Valuation Report for This Property
The Home Valuation Report is an in-depth analysis detailing your home's value as well as a comparison with similar homes in the area
Home Values in the Area
Average Home Value in this Area
Purchase History
| Date | Buyer | Sale Price | Title Company |
|---|---|---|---|
| Clemons Stephanie A | $80,000 | Attorney | |
| Suntrust Mortgage Inc | $128,220 | None Available | |
| Scott Charles | $127,900 | -- |
Source: Public Records
Mortgage History
| Date | Status | Borrower | Loan Amount |
|---|---|---|---|
| Open | Clemons Stephanie A | $76,000 | |
| Previous Owner | Scott Charles | $126,800 |
Source: Public Records
Tax History
| Year | Tax Paid | Tax Assessment Tax Assessment Total Assessment is a certain percentage of the fair market value that is determined by local assessors to be the total taxable value of land and additions on the property. | Land | Improvement |
|---|---|---|---|---|
| 2025 | $6,299 | $100,517 | $18,078 | $82,439 |
| 2024 | $6,128 | $100,517 | $18,078 | $82,439 |
| 2023 | $5,826 | $100,517 | $18,078 | $82,439 |
| 2022 | $4,958 | $76,154 | $16,342 | $59,812 |
| 2021 | $4,844 | $76,154 | $16,342 | $59,812 |
| 2020 | $4,896 | $76,154 | $16,342 | $59,812 |
| 2019 | $4,774 | $67,393 | $14,462 | $52,931 |
| 2018 | $4,473 | $67,393 | $14,462 | $52,931 |
| 2017 | $4,221 | $67,393 | $14,462 | $52,931 |
| 2016 | $2,627 | $40,800 | $14,753 | $26,047 |
| 2015 | $2,550 | $40,800 | $14,753 | $26,047 |
| 2014 | $2,552 | $40,800 | $14,753 | $26,047 |
| 2013 | $2,367 | $39,998 | $14,462 | $25,536 |
Source: Public Records
Map
Nearby Homes
- 6952 Shadow Ridge Rd
- 6168 Thole Rd
- 6381 Beaconwood Dr
- 6067 Salem Rd
- a Salem Rd
- 1 Salem Rd
- 1146 Brooke Ave
- 963 Holz Ave
- 3 Salem Rd
- 2 Salem Rd
- 4 Salem Rd
- 6521 Glade Ave
- 1559 Brandon Ave
- 1508 Beth Ln
- 1630 Dell Terrace
- 6123 Cambridge Ave
- 1361 Bursal Ave
- 6604 Ambar Ave
- 1184 Linden Hill Ln
- Sedgewick Plan at