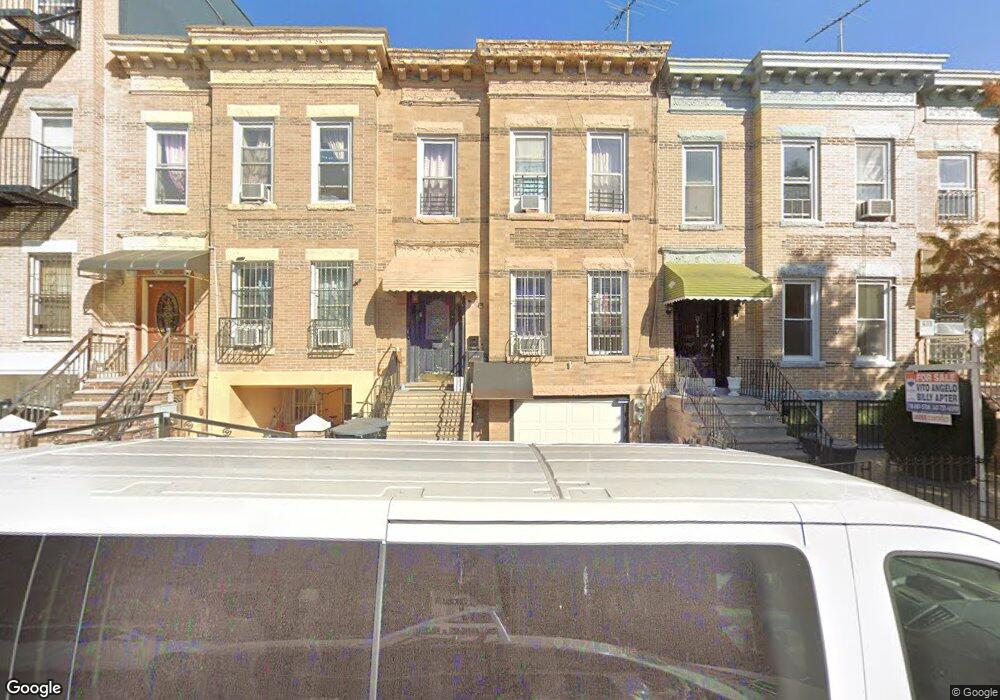
627 48th St Brooklyn, NY 11220
Sunset Park NeighborhoodEstimated Value: $1,473,000 - $1,731,000
Studio
--
Bath
1,864
Sq Ft
$844/Sq Ft
Est. Value
About This Home
This home is located at 627 48th St, Brooklyn, NY 11220 and is currently estimated at $1,572,957, approximately $843 per square foot. 627 48th St is a home located in Kings County with nearby schools including P.S. 169 Sunset Park, IS 220 John J. Pershing, and Leep Dual Language Academy Charter School.
Ownership History
Date
Name
Owned For
Owner Type
Purchase Details
Closed on
Jan 4, 2016
Sold by
Berard Aristedes
Bought by
Zheng Wang 627 Llc
Current Estimated Value
Home Financials for this Owner
Home Financials are based on the most recent Mortgage that was taken out on this home.
Original Mortgage
$560,000
Outstanding Balance
$445,671
Interest Rate
3.98%
Mortgage Type
Purchase Money Mortgage
Estimated Equity
$1,127,286
Create a Home Valuation Report for This Property
The Home Valuation Report is an in-depth analysis detailing your home's value as well as a comparison with similar homes in the area
Home Values in the Area
Average Home Value in this Area
Purchase History
| Date | Buyer | Sale Price | Title Company |
|---|---|---|---|
| Zheng Wang 627 Llc | $1,200,000 | -- |
Source: Public Records
Mortgage History
| Date | Status | Borrower | Loan Amount |
|---|---|---|---|
| Open | Zheng Wang 627 Llc | $560,000 |
Source: Public Records
Tax History
| Year | Tax Paid | Tax Assessment Tax Assessment Total Assessment is a certain percentage of the fair market value that is determined by local assessors to be the total taxable value of land and additions on the property. | Land | Improvement |
|---|---|---|---|---|
| 2025 | $7,340 | $88,740 | $25,800 | $62,940 |
| 2024 | $7,340 | $76,620 | $25,800 | $50,820 |
| 2023 | $7,422 | $90,540 | $25,800 | $64,740 |
| 2022 | $7,238 | $85,800 | $25,800 | $60,000 |
| 2021 | $7,199 | $79,500 | $25,800 | $53,700 |
| 2019 | $6,371 | $68,940 | $25,800 | $43,140 |
| 2018 | $6,208 | $30,456 | $11,938 | $18,518 |
| 2017 | $6,159 | $30,214 | $10,675 | $19,539 |
| 2016 | $5,699 | $28,507 | $11,413 | $17,094 |
| 2015 | $3,218 | $26,896 | $14,190 | $12,706 |
| 2014 | $3,218 | $25,380 | $16,068 | $9,312 |
Source: Public Records
Map
Nearby Homes
Your Personal Tour Guide
Ask me questions while you tour the home.