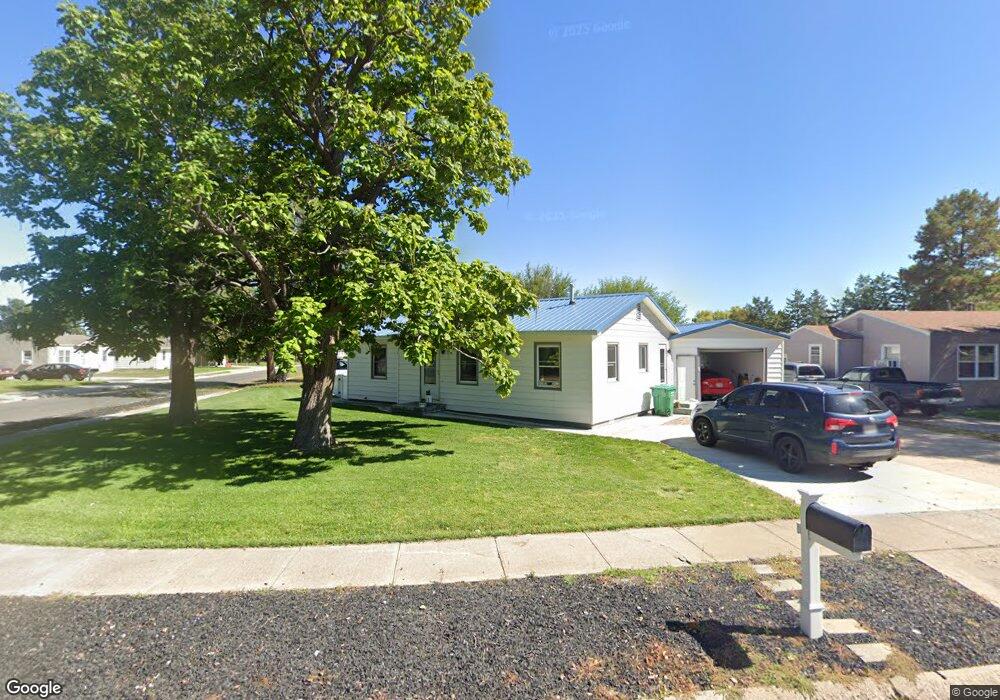
627 Charlotte Dr Sidney, NE 69162
Estimated Value: $114,000 - $145,000
3
Beds
1
Bath
934
Sq Ft
$140/Sq Ft
Est. Value
About This Home
This home is located at 627 Charlotte Dr, Sidney, NE 69162 and is currently estimated at $130,463, approximately $139 per square foot. 627 Charlotte Dr is a home located in Cheyenne County with nearby schools including Central Elementary School, South Ward Elementary School, and North Ward Elementary School.
Ownership History
Date
Name
Owned For
Owner Type
Purchase Details
Closed on
Jun 18, 2014
Sold by
Daniel J Daniel J and Turvey Amber L
Bought by
Kripal Douglas L
Current Estimated Value
Home Financials for this Owner
Home Financials are based on the most recent Mortgage that was taken out on this home.
Original Mortgage
$75,253
Interest Rate
4.18%
Mortgage Type
New Conventional
Purchase Details
Closed on
Apr 1, 2013
Sold by
Parks Sara R and Ekberg Sara
Bought by
Turvey Daniel J and Turvey Amber L
Home Financials for this Owner
Home Financials are based on the most recent Mortgage that was taken out on this home.
Original Mortgage
$81,975
Interest Rate
3.45%
Purchase Details
Closed on
Nov 24, 2009
Sold by
Dickman Jimmy Lee and Dickman Sally
Bought by
Ekberg Sara
Purchase Details
Closed on
Feb 19, 2008
Sold by
Dickman Jimmy Lee and Dickman Mandus Leroy
Bought by
Dickman Jimmy Lee
Create a Home Valuation Report for This Property
The Home Valuation Report is an in-depth analysis detailing your home's value as well as a comparison with similar homes in the area
Home Values in the Area
Average Home Value in this Area
Purchase History
| Date | Buyer | Sale Price | Title Company |
|---|---|---|---|
| Kripal Douglas L | -- | -- | |
| Turvey Daniel J | -- | -- | |
| Ekberg Sara | -- | -- | |
| Dickman Jimmy Lee | -- | -- |
Source: Public Records
Mortgage History
| Date | Status | Borrower | Loan Amount |
|---|---|---|---|
| Closed | Kripal Douglas L | $75,253 | |
| Previous Owner | Turvey Daniel J | $81,975 |
Source: Public Records
Tax History Compared to Growth
Tax History
| Year | Tax Paid | Tax Assessment Tax Assessment Total Assessment is a certain percentage of the fair market value that is determined by local assessors to be the total taxable value of land and additions on the property. | Land | Improvement |
|---|---|---|---|---|
| 2024 | $1,478 | $79,827 | $6,212 | $73,615 |
| 2023 | $1,769 | $78,222 | $6,212 | $72,010 |
| 2022 | $1,789 | $77,207 | $6,212 | $70,995 |
| 2021 | $1,603 | $68,547 | $6,212 | $62,335 |
| 2020 | $1,581 | $67,737 | $5,402 | $62,335 |
| 2019 | $1,409 | $60,822 | $5,402 | $55,420 |
| 2018 | $1,611 | $71,032 | $6,575 | $64,457 |
| 2017 | $1,765 | $78,925 | $7,306 | $71,619 |
| 2016 | $1,688 | $78,925 | $7,306 | $71,619 |
| 2015 | $1,708 | $78,925 | $7,306 | $71,619 |
| 2014 | $1,770 | $78,925 | $7,306 | $71,619 |
Source: Public Records
Map
Nearby Homes
- 1231 Forrest St
- 1905 Sidney Draw Rd
- 1449 21st Ave
- 410 20th Ave
- 1324 24th Ave
- 1825 Nebraska 19
- 00 Road 127
- County Road 6
- 421 Dunken Ave
- 34414 County Road 53
- 4819 Road 125
- Tbd Road 32
- 4667 Cr 129
- 1430 Road 145
- TBD Road 145
- Tbd Road 34
- TBD Road 34
- 32307 County Road 75
- 32207 County Road 75 Unit 32307
- 9178 Road 48
- 655 Charlotte Dr
- 615 Charlotte Dr
- 620 Osage St
- 659 Charlotte Dr
- 648 Charlotte Dr
- 624 Charlotte Dr
- 654 Charlotte Dr
- 618 Charlotte Dr
- 642 Charlotte Dr
- 630 Charlotte Dr
- 612 Charlotte Dr
- 660 Charlotte Dr
- 607 Charlotte Dr
- 636 Charlotte Dr
- 606 Charlotte Dr
- 603 Charlotte Dr
- 600 Charlotte Dr
- 601 Charlotte Dr
- 564 Keller Dr
- 595 Charlotte Dr