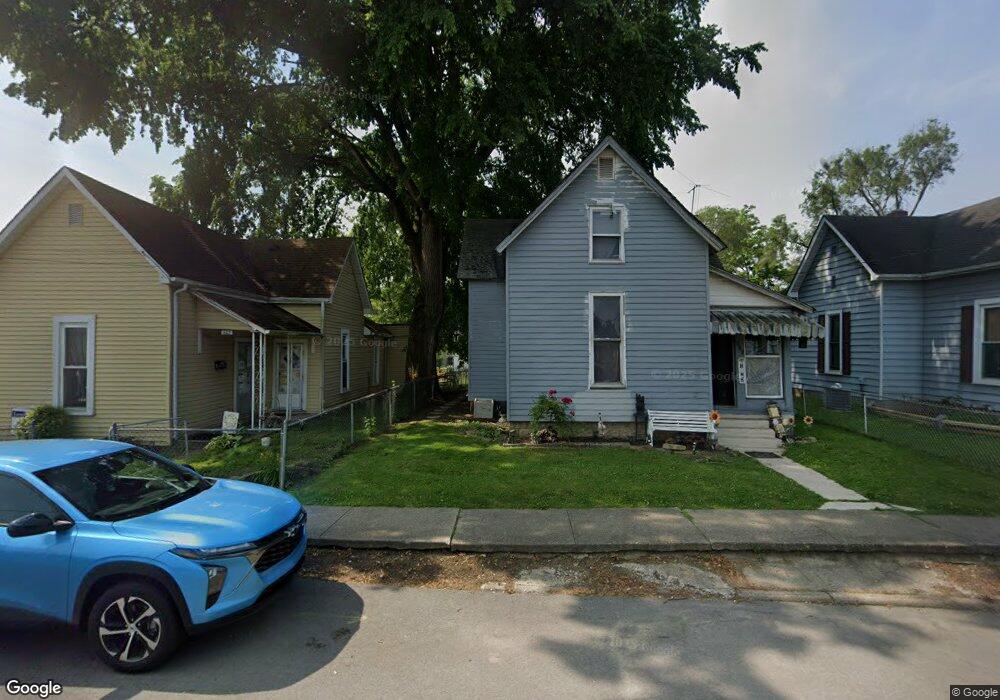
627 E 9th St Anderson, IN 46012
Estimated Value: $67,000 - $103,000
3
Beds
1
Bath
1,016
Sq Ft
$88/Sq Ft
Est. Value
About This Home
This home is located at 627 E 9th St, Anderson, IN 46012 and is currently estimated at $89,739, approximately $88 per square foot. 627 E 9th St is a home located in Madison County with nearby schools including Tenth Street Elementary School, Highland Middle School, and Anderson High School.
Ownership History
Date
Name
Owned For
Owner Type
Purchase Details
Closed on
Dec 9, 2008
Sold by
Campbell Turner E
Bought by
Ard Enterprises Llc
Current Estimated Value
Home Financials for this Owner
Home Financials are based on the most recent Mortgage that was taken out on this home.
Original Mortgage
$17,500
Interest Rate
6.04%
Mortgage Type
Future Advance Clause Open End Mortgage
Purchase Details
Closed on
Aug 1, 2005
Sold by
Combs Charles S
Bought by
Combs Charles S and Campbell Turner E
Create a Home Valuation Report for This Property
The Home Valuation Report is an in-depth analysis detailing your home's value as well as a comparison with similar homes in the area
Home Values in the Area
Average Home Value in this Area
Purchase History
| Date | Buyer | Sale Price | Title Company |
|---|---|---|---|
| Ard Enterprises Llc | -- | -- | |
| Combs Charles S | -- | -- |
Source: Public Records
Mortgage History
| Date | Status | Borrower | Loan Amount |
|---|---|---|---|
| Closed | Ard Enterprises Llc | $17,500 |
Source: Public Records
Tax History
| Year | Tax Paid | Tax Assessment Tax Assessment Total Assessment is a certain percentage of the fair market value that is determined by local assessors to be the total taxable value of land and additions on the property. | Land | Improvement |
|---|---|---|---|---|
| 2025 | $1,225 | $60,300 | $5,200 | $55,100 |
| 2024 | $1,225 | $55,100 | $5,200 | $49,900 |
| 2023 | $1,121 | $50,100 | $4,900 | $45,200 |
| 2022 | $1,119 | $50,000 | $4,800 | $45,200 |
| 2021 | $1,031 | $45,800 | $4,800 | $41,000 |
| 2020 | $985 | $43,600 | $4,600 | $39,000 |
| 2019 | $959 | $42,400 | $4,600 | $37,800 |
| 2018 | $898 | $38,900 | $4,600 | $34,300 |
| 2017 | $768 | $38,400 | $4,600 | $33,800 |
| 2016 | $768 | $38,400 | $4,600 | $33,800 |
| 2014 | $836 | $41,500 | $4,900 | $36,600 |
| 2013 | $836 | $41,500 | $4,900 | $36,600 |
Source: Public Records
Map
Nearby Homes
- 517 E 7th St
- 810 E 8th St
- 803 Cottage Ave
- 615-617 Ruddle Ave
- 908 Cottage Ave
- 809 College Dr
- 503 Central Ave
- 1111 E 7th St
- 1309 Pearl St
- 812 Chestnut St
- 914 Chestnut St
- 1432 Ohio Ave
- 1222 Central Ave
- 1413 Walnut St
- 1300 E 7th St
- 307 Cottage Ave
- 1527 Walnut St
- 20 & 22 W 8th St
- 22 W 8th St
- 225 College Dr
Your Personal Tour Guide
Ask me questions while you tour the home.