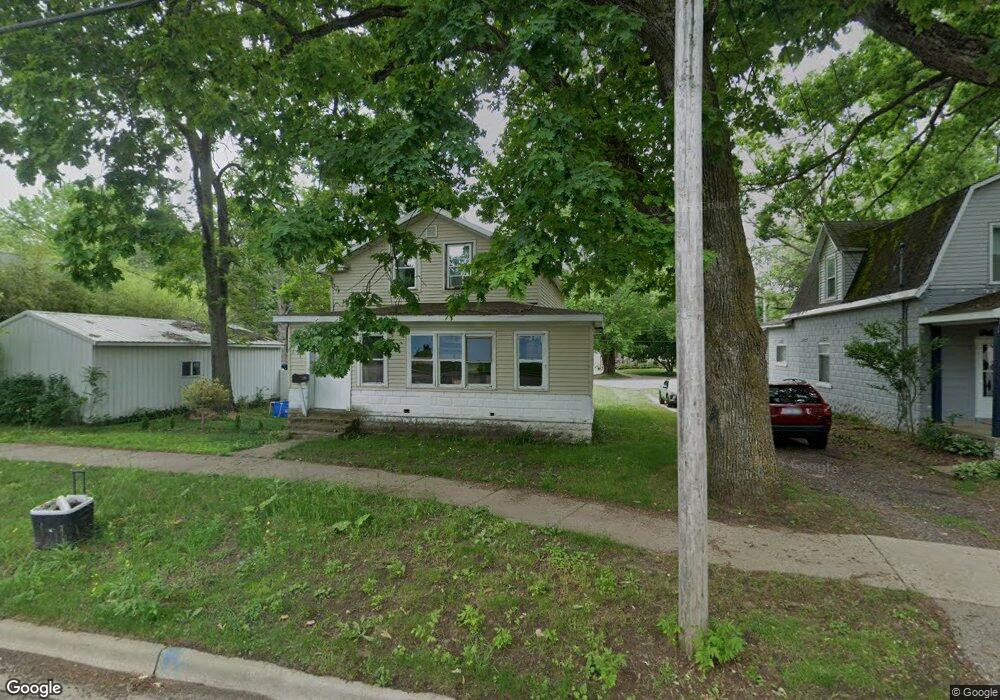
627 Ely St Allegan, MI 49010
Estimated Value: $153,212 - $224,000
3
Beds
1
Bath
1,275
Sq Ft
$149/Sq Ft
Est. Value
About This Home
This home is located at 627 Ely St, Allegan, MI 49010 and is currently estimated at $189,803, approximately $148 per square foot. 627 Ely St is a home located in Allegan County with nearby schools including West Ward Elementary School, L.E. White Middle School, and Allegan High School.
Ownership History
Date
Name
Owned For
Owner Type
Purchase Details
Closed on
Nov 16, 2021
Sold by
Mckenzie Angela A
Bought by
Antkoviak Peter H and Antkoviak Nancy A
Current Estimated Value
Purchase Details
Closed on
Jan 21, 2019
Sold by
Hanse John K
Bought by
Mckenzie Orlando and Mckenzie Angela A
Purchase Details
Closed on
Oct 9, 2014
Sold by
Hanse Carol Ann
Bought by
Hanse John Kevin
Purchase Details
Closed on
Apr 16, 2009
Sold by
Bent Karen
Bought by
Federal National Mortgage Association
Purchase Details
Closed on
Oct 10, 2000
Sold by
Adams Larry and Adams Deborah
Bought by
Bent Karen
Purchase Details
Closed on
Jul 1, 1991
Create a Home Valuation Report for This Property
The Home Valuation Report is an in-depth analysis detailing your home's value as well as a comparison with similar homes in the area
Home Values in the Area
Average Home Value in this Area
Purchase History
| Date | Buyer | Sale Price | Title Company |
|---|---|---|---|
| Antkoviak Peter H | $20,000 | None Available | |
| Mckenzie Orlando | -- | None Available | |
| Hanse John Kevin | -- | None Available | |
| Federal National Mortgage Association | $45,930 | None Available | |
| Bent Karen | $59,000 | -- | |
| -- | $6,000 | -- |
Source: Public Records
Tax History
| Year | Tax Paid | Tax Assessment Tax Assessment Total Assessment is a certain percentage of the fair market value that is determined by local assessors to be the total taxable value of land and additions on the property. | Land | Improvement |
|---|---|---|---|---|
| 2025 | $2,252 | $47,600 | $10,800 | $36,800 |
| 2024 | $2,029 | $40,900 | $9,300 | $31,600 |
| 2023 | $2,096 | $36,100 | $8,900 | $27,200 |
| 2022 | $2,029 | $32,100 | $7,400 | $24,700 |
| 2021 | $2,375 | $30,400 | $5,800 | $24,600 |
| 2020 | $936 | $26,100 | $5,400 | $20,700 |
| 2019 | $913 | $24,100 | $5,000 | $19,100 |
| 2018 | $826 | $20,200 | $4,900 | $15,300 |
| 2017 | $0 | $18,600 | $4,100 | $14,500 |
| 2016 | $0 | $15,300 | $3,400 | $11,900 |
| 2015 | -- | $15,300 | $3,400 | $11,900 |
| 2014 | -- | $16,000 | $3,400 | $12,600 |
| 2013 | $1,373 | $17,000 | $3,400 | $13,600 |
Source: Public Records
Map
Nearby Homes
Your Personal Tour Guide
Ask me questions while you tour the home.