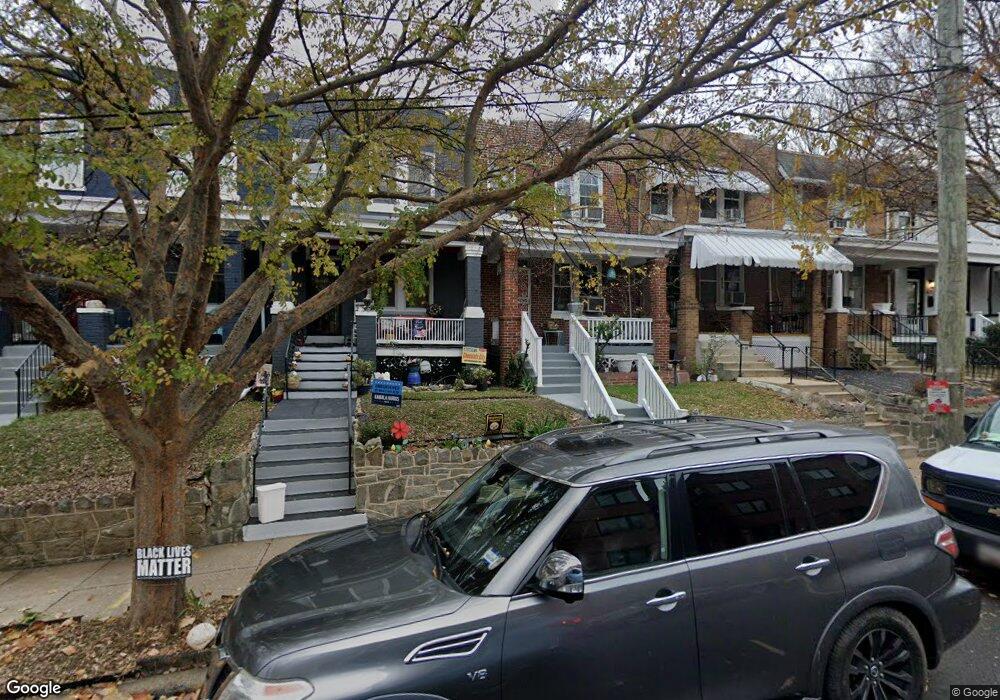
627 Girard St NE Washington, DC 20017
Edgewood NeighborhoodEstimated Value: $594,000 - $738,000
3
Beds
2
Baths
1,290
Sq Ft
$507/Sq Ft
Est. Value
About This Home
This home is located at 627 Girard St NE, Washington, DC 20017 and is currently estimated at $653,943, approximately $506 per square foot. 627 Girard St NE is a home located in District of Columbia with nearby schools including Noyes Elementary School, Brookland Middle School, and Dunbar High School.
Ownership History
Date
Name
Owned For
Owner Type
Purchase Details
Closed on
Aug 18, 2016
Sold by
Brown Barbara A
Bought by
Brown Barbara A and Nealy Noelle B
Current Estimated Value
Home Financials for this Owner
Home Financials are based on the most recent Mortgage that was taken out on this home.
Original Mortgage
$266,500
Outstanding Balance
$211,851
Interest Rate
3.45%
Mortgage Type
New Conventional
Estimated Equity
$442,092
Purchase Details
Closed on
Jul 25, 2014
Sold by
Brown Barbara A
Bought by
Brown Barbara A
Home Financials for this Owner
Home Financials are based on the most recent Mortgage that was taken out on this home.
Original Mortgage
$250,000
Interest Rate
4.12%
Mortgage Type
New Conventional
Purchase Details
Closed on
Aug 28, 1997
Sold by
Colvin Thelma G
Bought by
Nealy Brown Barbara A
Home Financials for this Owner
Home Financials are based on the most recent Mortgage that was taken out on this home.
Original Mortgage
$93,558
Interest Rate
7.41%
Mortgage Type
FHA
Create a Home Valuation Report for This Property
The Home Valuation Report is an in-depth analysis detailing your home's value as well as a comparison with similar homes in the area
Home Values in the Area
Average Home Value in this Area
Purchase History
| Date | Buyer | Sale Price | Title Company |
|---|---|---|---|
| Brown Barbara A | -- | None Available | |
| Brown Barbara A | -- | -- | |
| Nealy Brown Barbara A | -- | -- |
Source: Public Records
Mortgage History
| Date | Status | Borrower | Loan Amount |
|---|---|---|---|
| Open | Brown Barbara A | $266,500 | |
| Previous Owner | Brown Barbara A | $250,000 | |
| Previous Owner | Nealy Brown Barbara A | $93,558 |
Source: Public Records
Tax History Compared to Growth
Tax History
| Year | Tax Paid | Tax Assessment Tax Assessment Total Assessment is a certain percentage of the fair market value that is determined by local assessors to be the total taxable value of land and additions on the property. | Land | Improvement |
|---|---|---|---|---|
| 2025 | $4,070 | $612,810 | $384,590 | $228,220 |
| 2024 | $3,722 | $597,350 | $380,710 | $216,640 |
| 2023 | $3,407 | $575,320 | $368,170 | $207,150 |
| 2022 | $3,138 | $526,150 | $338,170 | $187,980 |
| 2021 | $2,871 | $512,750 | $333,150 | $179,600 |
| 2020 | $2,615 | $495,450 | $320,700 | $174,750 |
| 2019 | $2,384 | $483,130 | $309,430 | $173,700 |
| 2018 | $2,179 | $452,870 | $0 | $0 |
| 2017 | $1,988 | $419,840 | $0 | $0 |
| 2016 | $1,813 | $388,290 | $0 | $0 |
| 2015 | $1,650 | $356,430 | $0 | $0 |
| 2014 | $1,510 | $287,900 | $0 | $0 |
Source: Public Records
Map
Nearby Homes
- 2720 7th St NE Unit 301
- 3000 7th St NE Unit 101
- 3000 7th St NE Unit 124
- 2821 5th St NE
- 636 Edgewood St NE Unit A
- 636 Edgewood St NE Unit B
- 2855 Chancellors Way NE
- 622 Evarts St NE
- 517 Montana Ave NE Unit 3
- 2806 5th St NE
- 428 Evarts St NE Unit 2
- Edgewood Plan at Brookland Grove
- Whitlow Plan at Brookland Grove
- 2701 4th St NE Unit 101
- 413 Evarts St NE
- 466 Altezza Dr NE
- 2615 4th St NE Unit 303
- 2615 4th St NE Unit B3
- 917 Hamlin St NE
- 718 Jackson St NE Unit 1
- 629 Girard St NE
- 623 Girard St NE
- 625 Girard St NE
- 631 Girard St NE
- 633 Girard St NE
- 635 Girard St NE
- 619 Girard St NE
- 617 Girard St NE
- 637 Girard St NE
- 615 Girard St NE
- 639 Girard St NE
- 639 Girard St NE Unit 1
- 639 Girard St NE Unit 2
- 641 Girard St NE
- 613 Girard St NE
- 643 Girard St NE Unit 2
- 643 Girard St NE
- 628 Girard St NE
- 611 Girard St NE
- 614 Girard St NE