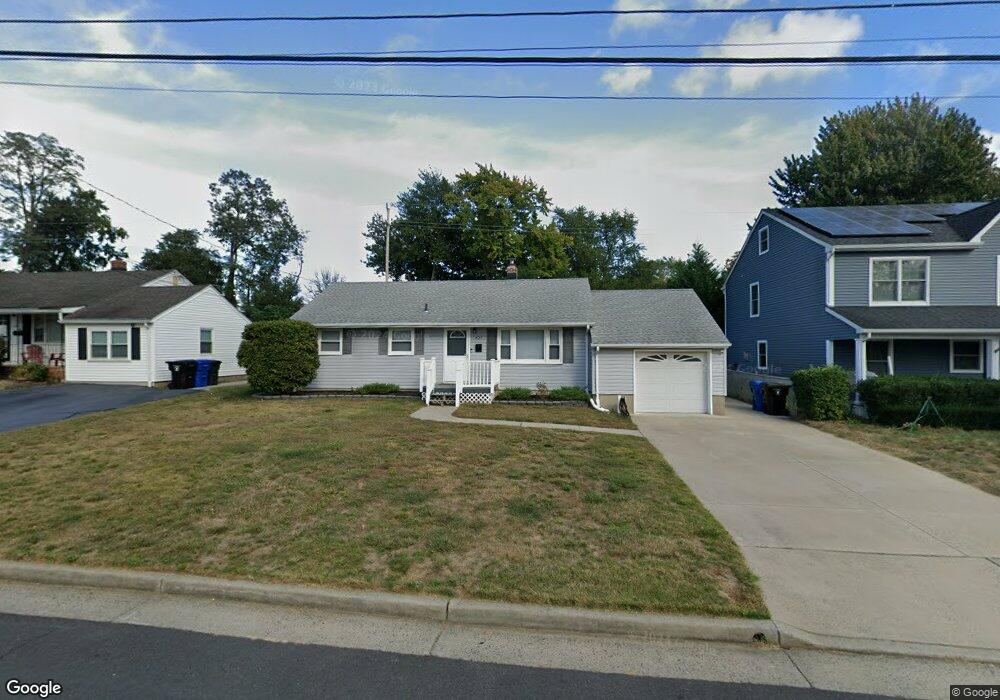
627 Hopping Rd Belford, NJ 07718
New Monmouth NeighborhoodEstimated Value: $413,000 - $545,000
3
Beds
1
Bath
912
Sq Ft
$518/Sq Ft
Est. Value
About This Home
This home is located at 627 Hopping Rd, Belford, NJ 07718 and is currently estimated at $472,783, approximately $518 per square foot. 627 Hopping Rd is a home located in Monmouth County with nearby schools including Bayview Elementary School, Bayshore Middle School, and Middletown High School North.
Ownership History
Date
Name
Owned For
Owner Type
Purchase Details
Closed on
Jun 10, 2021
Sold by
Reilly Sammond Colleen A and Reilly Gerard J
Bought by
Macey Mark and Macey Jacqueline
Current Estimated Value
Home Financials for this Owner
Home Financials are based on the most recent Mortgage that was taken out on this home.
Original Mortgage
$337,250
Outstanding Balance
$305,338
Interest Rate
2.9%
Mortgage Type
New Conventional
Estimated Equity
$167,445
Create a Home Valuation Report for This Property
The Home Valuation Report is an in-depth analysis detailing your home's value as well as a comparison with similar homes in the area
Home Values in the Area
Average Home Value in this Area
Purchase History
| Date | Buyer | Sale Price | Title Company |
|---|---|---|---|
| Macey Mark | $355,000 | Chicago Title Insurance Co | |
| Macey Mark | $355,000 | Chicago Title |
Source: Public Records
Mortgage History
| Date | Status | Borrower | Loan Amount |
|---|---|---|---|
| Open | Macey Mark | $337,250 | |
| Closed | Macey Mark | $337,250 |
Source: Public Records
Tax History Compared to Growth
Tax History
| Year | Tax Paid | Tax Assessment Tax Assessment Total Assessment is a certain percentage of the fair market value that is determined by local assessors to be the total taxable value of land and additions on the property. | Land | Improvement |
|---|---|---|---|---|
| 2025 | $6,615 | $471,600 | $347,500 | $124,100 |
| 2024 | $6,398 | $402,100 | $280,200 | $121,900 |
| 2023 | $6,398 | $368,100 | $276,000 | $92,100 |
| 2022 | $4,704 | $322,900 | $235,600 | $87,300 |
| 2021 | $4,704 | $258,600 | $181,000 | $77,600 |
| 2020 | $5,561 | $260,100 | $178,500 | $81,600 |
| 2019 | $5,483 | $259,600 | $178,500 | $81,100 |
| 2018 | $4,926 | $227,300 | $150,000 | $77,300 |
| 2017 | $4,925 | $225,000 | $150,000 | $75,000 |
| 2016 | $4,646 | $218,000 | $140,000 | $78,000 |
| 2015 | $4,557 | $217,800 | $140,000 | $77,800 |
| 2014 | $4,527 | $211,100 | $140,000 | $71,100 |
Source: Public Records
Map
Nearby Homes
- 672 Hopping Rd
- 573 Sumner Ave
- 310 East Rd
- 149 9th St
- 135 Railroad Ave
- 143 Tindall Rd
- 309 Church St
- 2 Pomo Ct
- 33 Swartzel Dr
- 79 Compton St Unit A & B
- 4 Del Ray Ct
- 35 Willow St
- 86 Washington Ave
- 786 Leonardville Rd
- 6 Augustus Dr
- 630 Kings Hwy E
- 7 Rosewood Terrace
- 22 Edmund Way
- 59 Florence Ave
- 617 Carter Ave