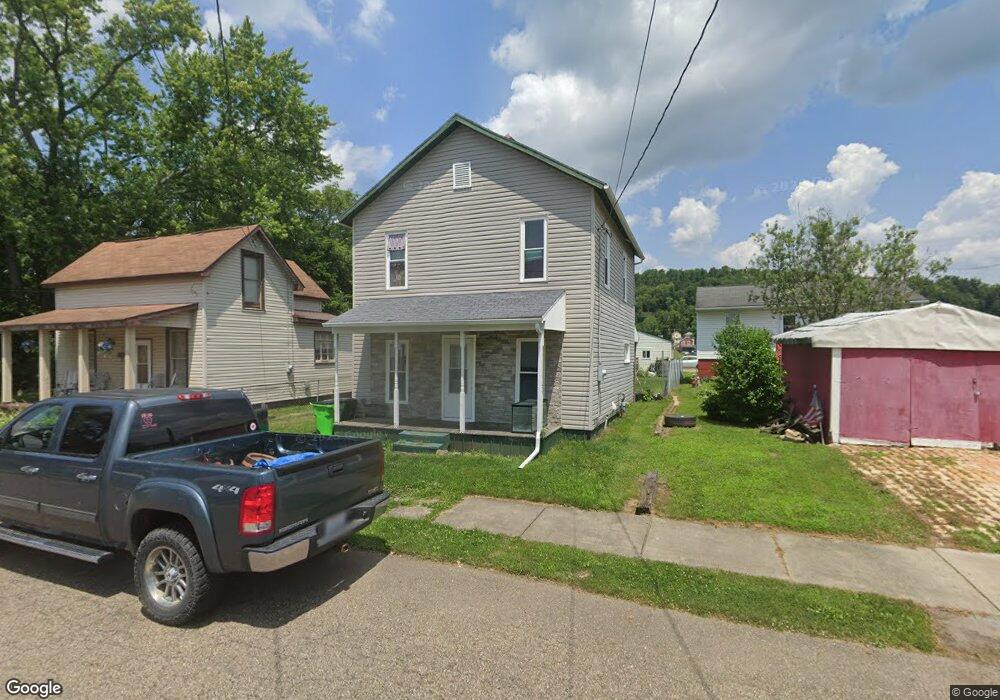
627 Logan St Dennison, OH 44621
Estimated Value: $79,975 - $149,000
3
Beds
2
Baths
1,144
Sq Ft
$102/Sq Ft
Est. Value
About This Home
This home is located at 627 Logan St, Dennison, OH 44621 and is currently estimated at $116,744, approximately $102 per square foot. 627 Logan St is a home located in Tuscarawas County with nearby schools including Claymont High School and Immaculate Conception School.
Ownership History
Date
Name
Owned For
Owner Type
Purchase Details
Closed on
Nov 20, 2018
Sold by
Wardell Jack and Wardell Nancy Marie
Bought by
Mcdonald Marcie M and Crouse Heather
Current Estimated Value
Home Financials for this Owner
Home Financials are based on the most recent Mortgage that was taken out on this home.
Original Mortgage
$72,094
Outstanding Balance
$63,958
Interest Rate
5.25%
Mortgage Type
FHA
Estimated Equity
$52,786
Purchase Details
Closed on
Dec 29, 2003
Sold by
Wardell Jack and Wardell Wanda
Bought by
Wardell Jack
Home Financials for this Owner
Home Financials are based on the most recent Mortgage that was taken out on this home.
Original Mortgage
$50,000
Interest Rate
6.99%
Mortgage Type
Purchase Money Mortgage
Purchase Details
Closed on
Oct 20, 1987
Bought by
Wardell Jack
Create a Home Valuation Report for This Property
The Home Valuation Report is an in-depth analysis detailing your home's value as well as a comparison with similar homes in the area
Home Values in the Area
Average Home Value in this Area
Purchase History
| Date | Buyer | Sale Price | Title Company |
|---|---|---|---|
| Mcdonald Marcie M | $73,425 | American Title | |
| Wardell Jack | $62,500 | Chelsea Title Agency | |
| Wardell Jack | $3,000 | -- |
Source: Public Records
Mortgage History
| Date | Status | Borrower | Loan Amount |
|---|---|---|---|
| Open | Mcdonald Marcie M | $72,094 | |
| Closed | Wardell Jack | $50,000 |
Source: Public Records
Tax History
| Year | Tax Paid | Tax Assessment Tax Assessment Total Assessment is a certain percentage of the fair market value that is determined by local assessors to be the total taxable value of land and additions on the property. | Land | Improvement |
|---|---|---|---|---|
| 2024 | $667 | $18,270 | $2,510 | $15,760 |
| 2023 | $667 | $52,180 | $7,160 | $45,020 |
| 2022 | $671 | $18,263 | $2,506 | $15,757 |
| 2021 | $620 | $15,726 | $1,621 | $14,105 |
| 2020 | $633 | $15,726 | $1,621 | $14,105 |
| 2019 | $605 | $15,726 | $1,621 | $14,105 |
| 2018 | $536 | $13,280 | $1,370 | $11,910 |
| 2017 | $566 | $13,280 | $1,370 | $11,910 |
| 2016 | $562 | $13,280 | $1,370 | $11,910 |
| 2014 | $546 | $12,790 | $1,370 | $11,420 |
| 2013 | $551 | $12,790 | $1,370 | $11,420 |
Source: Public Records
Map
Nearby Homes
- 318 Bank St
- 118 Woodland Ave
- 530 E High St
- 11 Sherman St
- 214 N Dawson St
- 228 Gardner Ave
- 426 Mccrea Ave
- 129 S Main St
- 213 Fuhr St
- 4848 Fette Rd SE
- 618 Parrish St
- 214 W 7th St
- 911 N Water St
- 315 Orchard St
- 507 W 3rd St
- 515 W 3rd St
- 621 Newport Ave
- 1107 Parrish St
- 7261 Waterworks Hill Rd SE
- 335 Packer St
Your Personal Tour Guide
Ask me questions while you tour the home.