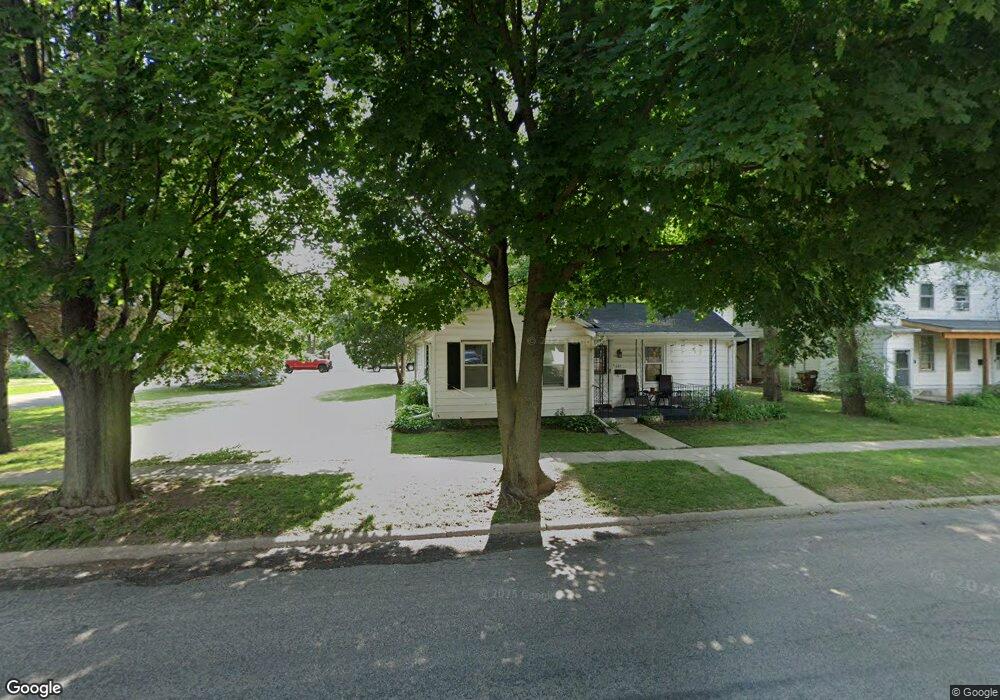
627 N 9th St Rochelle, IL 61068
Estimated Value: $138,747 - $150,000
2
Beds
1
Bath
1,100
Sq Ft
$133/Sq Ft
Est. Value
About This Home
This home is located at 627 N 9th St, Rochelle, IL 61068 and is currently estimated at $145,937, approximately $132 per square foot. 627 N 9th St is a home located in Ogle County with nearby schools including Rochelle Township High School and St. Paul Lutheran School.
Ownership History
Date
Name
Owned For
Owner Type
Purchase Details
Closed on
May 22, 2019
Sold by
Schoenholz Matthew R and Schoenholz Ellyn D
Bought by
M E E M Rentals Llc
Current Estimated Value
Purchase Details
Closed on
May 29, 2018
Sold by
Dunn Gary and Halterman Lori J
Bought by
Schoenholz Matthew R and Schoenholz Ellyn D
Home Financials for this Owner
Home Financials are based on the most recent Mortgage that was taken out on this home.
Original Mortgage
$295,000
Interest Rate
4.5%
Mortgage Type
New Conventional
Purchase Details
Closed on
May 31, 2007
Sold by
Burton Sonia G
Bought by
Dunn Gary K and Halterman Lori H
Home Financials for this Owner
Home Financials are based on the most recent Mortgage that was taken out on this home.
Original Mortgage
$79,400
Interest Rate
6.21%
Mortgage Type
New Conventional
Create a Home Valuation Report for This Property
The Home Valuation Report is an in-depth analysis detailing your home's value as well as a comparison with similar homes in the area
Home Values in the Area
Average Home Value in this Area
Purchase History
| Date | Buyer | Sale Price | Title Company |
|---|---|---|---|
| M E E M Rentals Llc | -- | None Available | |
| Schoenholz Matthew R | $295,000 | None Available | |
| Dunn Gary K | $97,250 | None Available |
Source: Public Records
Mortgage History
| Date | Status | Borrower | Loan Amount |
|---|---|---|---|
| Previous Owner | Schoenholz Matthew R | $295,000 | |
| Previous Owner | Dunn Gary K | $79,400 |
Source: Public Records
Tax History
| Year | Tax Paid | Tax Assessment Tax Assessment Total Assessment is a certain percentage of the fair market value that is determined by local assessors to be the total taxable value of land and additions on the property. | Land | Improvement |
|---|---|---|---|---|
| 2024 | $2,762 | $37,220 | $12,011 | $25,209 |
| 2023 | $2,549 | $34,834 | $11,241 | $23,593 |
| 2022 | $2,529 | $33,147 | $10,697 | $22,450 |
| 2021 | $2,360 | $30,621 | $9,882 | $20,739 |
| 2020 | $2,243 | $29,162 | $9,411 | $19,751 |
| 2019 | $2,192 | $28,660 | $9,249 | $19,411 |
| 2018 | $2,127 | $28,098 | $9,068 | $19,030 |
| 2017 | $2,098 | $28,098 | $9,068 | $19,030 |
| 2016 | $2,065 | $27,327 | $8,819 | $18,508 |
| 2015 | $1,998 | $26,871 | $8,672 | $18,199 |
| 2014 | $2,097 | $26,871 | $8,672 | $18,199 |
| 2013 | $2,217 | $28,169 | $9,091 | $19,078 |
Source: Public Records
Map
Nearby Homes
- 821 N 8th St
- 421 7th Ave
- 500 Woolf Ct
- 1022 1st Ave
- 1170 Westview Dr
- 1164 Westview Dr
- 1061 Meadow Ln
- 712 Kelley Dr
- 30 Tilton Manor Dr Unit 205
- 901 Garfield Dr
- 1133 N 7th St Unit 506
- 1116 Carrie Ave
- Lot 11 Kelley Dr
- 1401 Carrie Ave
- 907 Carlisle Dr
- 909 Carlisle Dr
- 201 Janet Ave
- 1010 S 7th St
- 5299 S Harlan Dr
- 000 E Flagg Rd
Your Personal Tour Guide
Ask me questions while you tour the home.