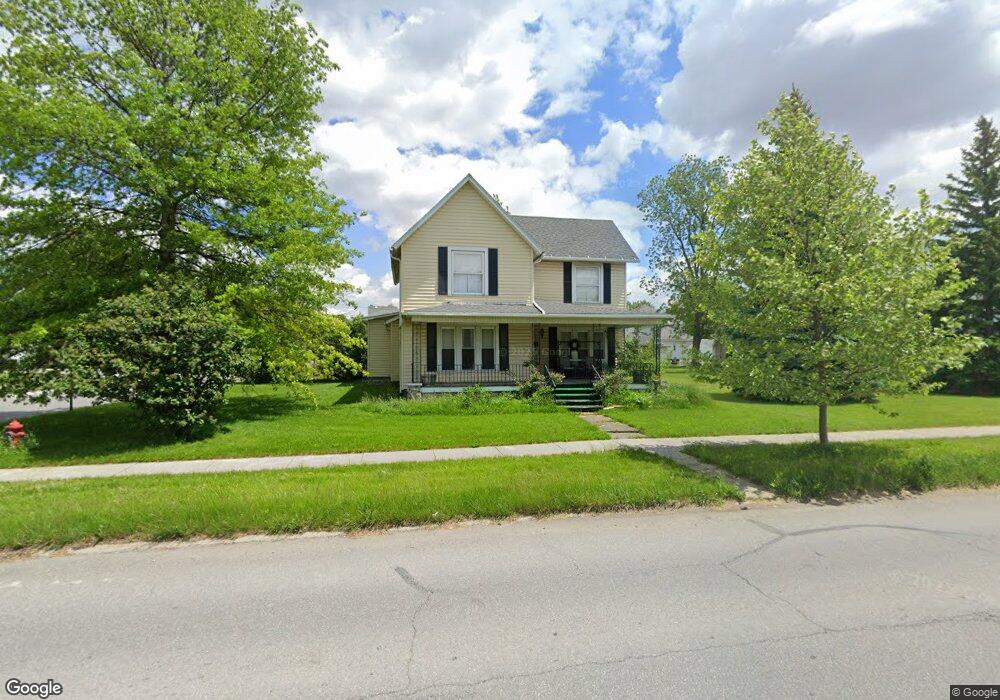
627 N Williams St Paulding, OH 45879
Estimated Value: $137,231 - $195,000
4
Beds
2
Baths
2,022
Sq Ft
$79/Sq Ft
Est. Value
About This Home
This home is located at 627 N Williams St, Paulding, OH 45879 and is currently estimated at $159,808, approximately $79 per square foot. 627 N Williams St is a home located in Paulding County with nearby schools including Paulding High School.
Ownership History
Date
Name
Owned For
Owner Type
Purchase Details
Closed on
May 10, 2019
Sold by
True Grit Llc
Bought by
Omonayin Julius O
Current Estimated Value
Home Financials for this Owner
Home Financials are based on the most recent Mortgage that was taken out on this home.
Original Mortgage
$79,200
Outstanding Balance
$68,609
Interest Rate
4%
Mortgage Type
New Conventional
Estimated Equity
$91,199
Purchase Details
Closed on
Dec 20, 2013
Sold by
Livin Bakle Rhonda L
Bought by
True Grit Llc
Purchase Details
Closed on
Mar 20, 2013
Sold by
Livi Bakle Timothy R
Bought by
Livin Bakle Rhonda L and Rhonda L Bakle Revocable Living Trust
Purchase Details
Closed on
Jun 2, 2010
Sold by
Bakle Timothy R and Bakle Rhonda L
Bought by
Livi Bakle Timothy R and Timothy R Bakle Revocable Living Trust
Purchase Details
Closed on
May 1, 1984
Bought by
True Grit Llc
Create a Home Valuation Report for This Property
The Home Valuation Report is an in-depth analysis detailing your home's value as well as a comparison with similar homes in the area
Home Values in the Area
Average Home Value in this Area
Purchase History
| Date | Buyer | Sale Price | Title Company |
|---|---|---|---|
| Omonayin Julius O | $88,000 | None Available | |
| True Grit Llc | $30,000 | None Available | |
| Livin Bakle Rhonda L | -- | None Available | |
| Livi Bakle Timothy R | -- | None Available | |
| True Grit Llc | $32,000 | -- |
Source: Public Records
Mortgage History
| Date | Status | Borrower | Loan Amount |
|---|---|---|---|
| Open | Omonayin Julius O | $79,200 |
Source: Public Records
Tax History
| Year | Tax Paid | Tax Assessment Tax Assessment Total Assessment is a certain percentage of the fair market value that is determined by local assessors to be the total taxable value of land and additions on the property. | Land | Improvement |
|---|---|---|---|---|
| 2025 | $1,849 | $42,700 | $7,560 | $35,140 |
| 2024 | $1,849 | $32,830 | $5,810 | $27,020 |
| 2023 | $1,477 | $32,830 | $5,810 | $27,020 |
| 2022 | $1,432 | $32,830 | $5,810 | $27,020 |
| 2021 | $1,270 | $25,910 | $5,360 | $20,550 |
| 2020 | $1,136 | $25,910 | $5,360 | $20,550 |
| 2019 | $1,173 | $25,910 | $5,360 | $20,550 |
| 2018 | $1,195 | $25,910 | $5,360 | $20,550 |
| 2017 | $1,196 | $25,910 | $5,360 | $20,550 |
| 2016 | $1,196 | $25,910 | $5,360 | $20,550 |
| 2015 | $1,190 | $26,150 | $4,940 | $21,210 |
| 2014 | $1,034 | $22,830 | $4,940 | $17,890 |
| 2013 | $1,036 | $29,440 | $4,940 | $24,500 |
Source: Public Records
Map
Nearby Homes
- 621 N Williams St
- 000 E Baldwin
- 615 N Williams St
- 626 N Main St
- 620 N Main St
- 626 N Williams St
- 614 N Main St
- 709 N Williams St
- 620 N Williams St
- 702 N Williams St
- 702 N Main St
- 700 N Main St
- 612 N Williams St
- 708 N Main St
- 708 N Williams St
- 715 N Williams St
- 608 N Main St
- 607 N Williams St
- 607 N Williams St
- 608 N Williams St
Your Personal Tour Guide
Ask me questions while you tour the home.