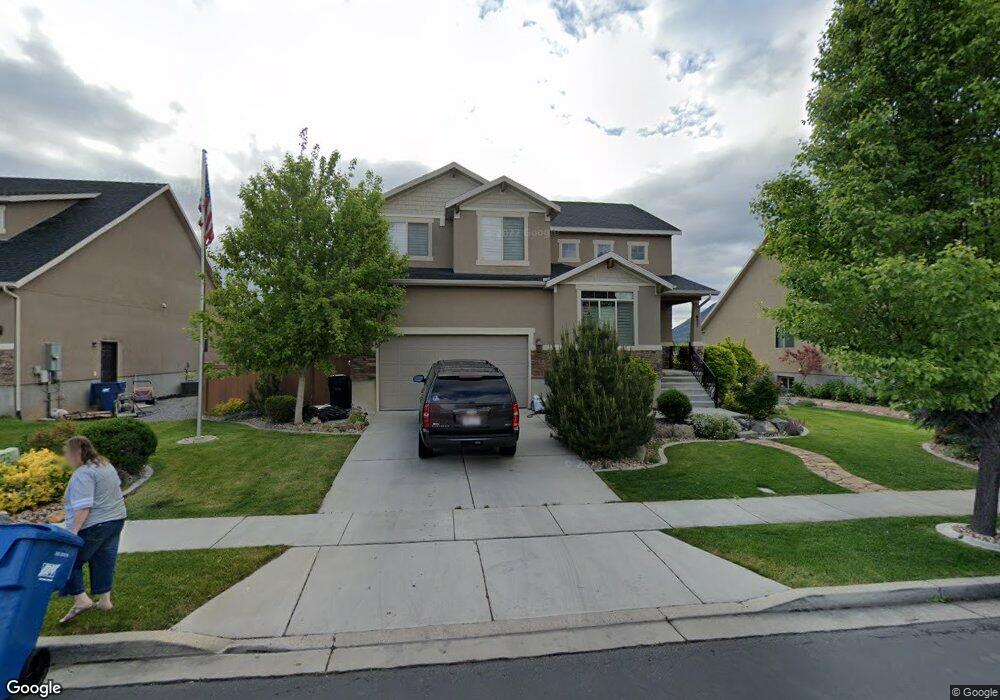
627 S 750 W Spanish Fork, UT 84660
Estimated Value: $617,000 - $646,088
4
Beds
4
Baths
3,086
Sq Ft
$206/Sq Ft
Est. Value
About This Home
This home is located at 627 S 750 W, Spanish Fork, UT 84660 and is currently estimated at $634,772, approximately $205 per square foot. 627 S 750 W is a home located in Utah County with nearby schools including Riverview Elementary School, Spanish Fork Jr High School, and Spanish Fork High School.
Ownership History
Date
Name
Owned For
Owner Type
Purchase Details
Closed on
Oct 11, 2019
Sold by
Smith Michelle and Smithjo Ann Forelich Trust
Bought by
Swenson Stephen and Swenson Wendy
Current Estimated Value
Home Financials for this Owner
Home Financials are based on the most recent Mortgage that was taken out on this home.
Original Mortgage
$308,000
Outstanding Balance
$204,815
Interest Rate
3.4%
Mortgage Type
New Conventional
Estimated Equity
$429,957
Purchase Details
Closed on
May 24, 2016
Sold by
Froelich Jo Ann
Bought by
Froelich Jo Ann and Jo Ann Froelich Trust
Purchase Details
Closed on
Nov 26, 2007
Sold by
Alpine Homes Inc
Bought by
Froelich Jo Ann
Home Financials for this Owner
Home Financials are based on the most recent Mortgage that was taken out on this home.
Original Mortgage
$310,700
Interest Rate
6.38%
Mortgage Type
Purchase Money Mortgage
Create a Home Valuation Report for This Property
The Home Valuation Report is an in-depth analysis detailing your home's value as well as a comparison with similar homes in the area
Home Values in the Area
Average Home Value in this Area
Purchase History
| Date | Buyer | Sale Price | Title Company |
|---|---|---|---|
| Swenson Stephen | -- | Stewart Title Ins Agcy Of Ut | |
| Froelich Jo Ann | -- | None Available | |
| Froelich Jo Ann | -- | First American Union Park |
Source: Public Records
Mortgage History
| Date | Status | Borrower | Loan Amount |
|---|---|---|---|
| Open | Swenson Stephen | $308,000 | |
| Previous Owner | Froelich Jo Ann | $310,700 |
Source: Public Records
Tax History Compared to Growth
Tax History
| Year | Tax Paid | Tax Assessment Tax Assessment Total Assessment is a certain percentage of the fair market value that is determined by local assessors to be the total taxable value of land and additions on the property. | Land | Improvement |
|---|---|---|---|---|
| 2025 | $2,901 | $320,760 | $212,700 | $370,500 |
| 2024 | $2,901 | $298,980 | $0 | $0 |
| 2023 | $2,998 | $309,375 | $0 | $0 |
| 2022 | $3,207 | $324,555 | $0 | $0 |
| 2021 | $2,930 | $474,300 | $154,300 | $320,000 |
| 2020 | $2,698 | $424,700 | $140,300 | $284,400 |
| 2019 | $2,086 | $345,500 | $140,300 | $205,200 |
| 2018 | $2,029 | $324,800 | $125,500 | $199,300 |
| 2017 | $1,801 | $154,990 | $0 | $0 |
| 2016 | $1,819 | $154,440 | $0 | $0 |
| 2015 | $1,665 | $139,700 | $0 | $0 |
| 2014 | $1,490 | $125,455 | $0 | $0 |
Source: Public Records
Map
Nearby Homes
- 501 S 880 W
- 2645 W 360 S Unit 1
- 2576 W 360 S Unit 5
- 1701 Del Monte Rd Unit 21
- 1076 River Hill Dr
- 351 W 530 S
- 231 S 880 W
- 1026 W 350 S
- 984 S 550 W Unit 917
- 1171 W 800 S Unit 38
- 787 W 1120 S
- 903 W 100 S
- 333 S 1170 W
- 1152 S 800 W
- 1256 W 800 S Unit 25
- 1256 W 800 S
- 429 S 1280 W
- 733 S 170 W
- 134 W 700 S
- 88 S 400 W