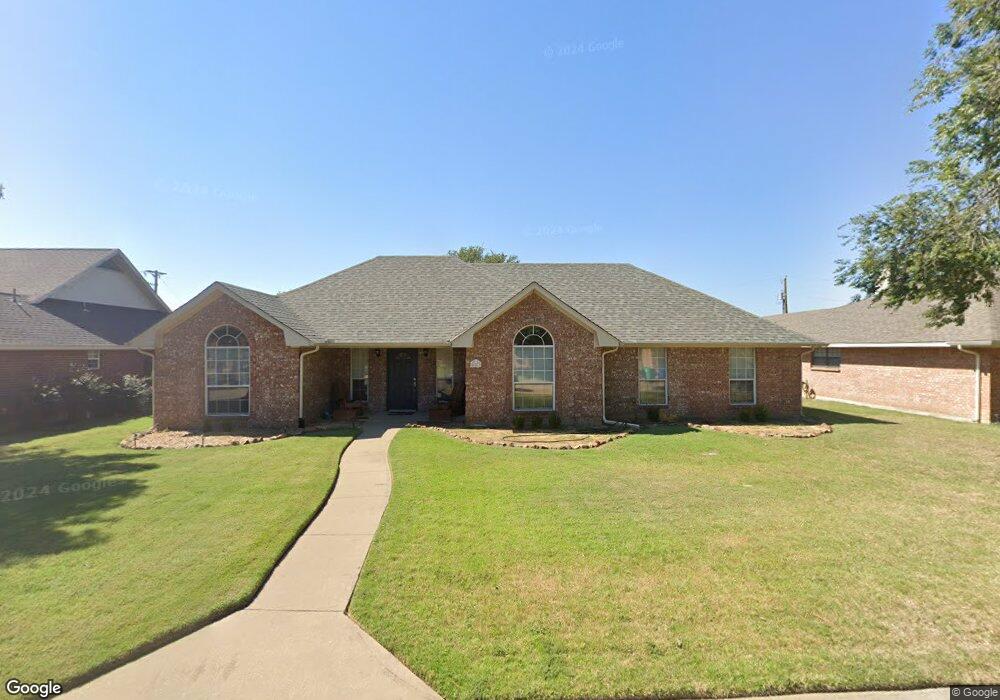
627 S Arizona Dr Celina, TX 75009
Estimated Value: $390,000 - $427,000
3
Beds
2
Baths
1,746
Sq Ft
$230/Sq Ft
Est. Value
About This Home
This home is located at 627 S Arizona Dr, Celina, TX 75009 and is currently estimated at $401,732, approximately $230 per square foot. 627 S Arizona Dr is a home located in Collin County with nearby schools including Celina Primary School, Marcy B. Lykins Elementary School, and Moore Middle School.
Ownership History
Date
Name
Owned For
Owner Type
Purchase Details
Closed on
Sep 13, 2016
Sold by
Earhart Verna A
Bought by
Jones Matthew
Current Estimated Value
Home Financials for this Owner
Home Financials are based on the most recent Mortgage that was taken out on this home.
Original Mortgage
$194,344
Outstanding Balance
$155,235
Interest Rate
3.43%
Estimated Equity
$246,497
Purchase Details
Closed on
Oct 1, 2003
Sold by
Wells Alan R and Wells Stephanie R
Bought by
Earhart Verna A
Purchase Details
Closed on
May 7, 1997
Sold by
Dickerson Lewis D
Bought by
Wells Alan R and Wells Stephanie R
Home Financials for this Owner
Home Financials are based on the most recent Mortgage that was taken out on this home.
Original Mortgage
$84,000
Interest Rate
7.97%
Create a Home Valuation Report for This Property
The Home Valuation Report is an in-depth analysis detailing your home's value as well as a comparison with similar homes in the area
Home Values in the Area
Average Home Value in this Area
Purchase History
| Date | Buyer | Sale Price | Title Company |
|---|---|---|---|
| Jones Matthew | -- | Chicago Title | |
| Earhart Verna A | -- | -- | |
| Wells Alan R | -- | -- |
Source: Public Records
Mortgage History
| Date | Status | Borrower | Loan Amount |
|---|---|---|---|
| Open | Jones Matthew | $194,344 | |
| Previous Owner | Wells Alan R | $84,000 |
Source: Public Records
Tax History Compared to Growth
Tax History
| Year | Tax Paid | Tax Assessment Tax Assessment Total Assessment is a certain percentage of the fair market value that is determined by local assessors to be the total taxable value of land and additions on the property. | Land | Improvement |
|---|---|---|---|---|
| 2025 | $5,624 | $362,571 | $155,000 | $207,571 |
| 2024 | $5,624 | $336,743 | $155,000 | $234,113 |
| 2023 | $5,624 | $306,130 | $120,000 | $285,133 |
| 2022 | $6,378 | $278,300 | $75,000 | $233,881 |
| 2021 | $5,931 | $254,000 | $65,000 | $189,000 |
| 2020 | $5,635 | $230,000 | $60,000 | $170,000 |
| 2019 | $5,960 | $234,000 | $60,000 | $174,000 |
| 2018 | $5,856 | $229,000 | $50,000 | $179,000 |
| 2017 | $4,917 | $192,307 | $45,000 | $147,307 |
| 2016 | $4,191 | $179,657 | $35,000 | $144,657 |
| 2015 | $2,215 | $155,153 | $35,000 | $120,153 |
Source: Public Records
Map
Nearby Homes
- 629 Cork Dr
- 621 Cork Dr
- 614 Cork Dr
- 614 S Georgia St
- 557 S Utah Dr
- 514 S Arizona Dr
- 528 S Alabama Dr
- 611 W Sycamore St
- 506 S Ohio St
- 516 S Alabama St
- 509 W Ash St
- 910 W Bois d Arc St
- 931 W Cedar St
- 607 W Ash St
- 850 Mellanie Ct
- 611 W Ash St
- 205 W Ash St
- 309 S Arizona Dr
- 309 S Louisiana St
- 610 Cork Dr
- 625 S Arizona Dr
- 629 S Arizona Dr
- 623 S Arizona Dr
- 624 S Arizona Dr
- 622 S Arizona Dr
- 626 S Arizona Dr
- 620 S Arizona Dr
- 418 Winn Rd
- 416 Winn Rd
- 414 Winn Rd
- 618 S Arizona Dr
- 619 S Arizona Dr
- 412 Winn Rd
- 616 S Arizona Dr
- 410 Winn Rd
- 615 S Colorado St
- 617 S Arizona Dr
- 613 S Colorado St
- 614 S Arizona Dr
- 617 S Colorado St