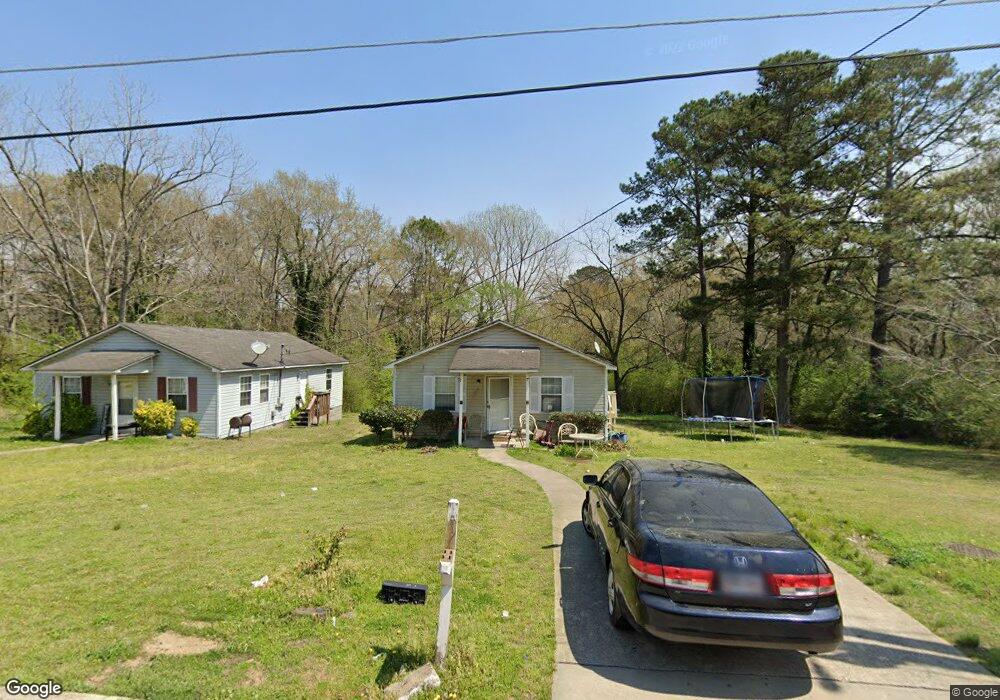
627 Smoot St Lagrange, GA 30241
Estimated Value: $96,586 - $130,000
2
Beds
1
Bath
1,040
Sq Ft
$107/Sq Ft
Est. Value
About This Home
This home is located at 627 Smoot St, Lagrange, GA 30241 and is currently estimated at $111,147, approximately $106 per square foot. 627 Smoot St is a home located in Troup County with nearby schools including Callaway Elementary School, Hogansville Elementary School, and Callaway Middle School.
Ownership History
Date
Name
Owned For
Owner Type
Purchase Details
Closed on
Mar 12, 2003
Sold by
Donald G Thomas
Bought by
Abet Solutions Inc
Current Estimated Value
Purchase Details
Closed on
Nov 19, 2001
Sold by
Provident Bank
Bought by
Donald G Thomas
Purchase Details
Closed on
Jul 20, 1999
Sold by
Accent Mortgage Co
Bought by
Provident Bank
Purchase Details
Closed on
Jun 30, 1999
Sold by
Dalton R Humphrey
Bought by
Accent Mortgage Co
Purchase Details
Closed on
Jan 3, 1996
Sold by
Sge Mort
Bought by
Sge Mortgage Funding Corp
Purchase Details
Closed on
Mar 12, 1993
Sold by
Simpson J
Bought by
Sge Mort
Purchase Details
Closed on
Oct 5, 1992
Sold by
Simpson J
Bought by
Simpson J
Purchase Details
Closed on
May 28, 1991
Sold by
Estella Simpson
Bought by
Simpson J
Purchase Details
Closed on
Jan 1, 1960
Sold by
Lawrence Simpson
Bought by
Estella Simpson
Create a Home Valuation Report for This Property
The Home Valuation Report is an in-depth analysis detailing your home's value as well as a comparison with similar homes in the area
Purchase History
| Date | Buyer | Sale Price | Title Company |
|---|---|---|---|
| Abet Solutions Inc | -- | -- | |
| Donald G Thomas | $34,000 | -- | |
| Provident Bank | $49,800 | -- | |
| Accent Mortgage Co | -- | -- | |
| Sge Mortgage Funding Corp | $10,000 | -- | |
| Sge Mort | $27,000 | -- | |
| Simpson J | -- | -- | |
| Simpson J | -- | -- | |
| Estella Simpson | -- | -- |
Source: Public Records
Tax History
| Year | Tax Paid | Tax Assessment Tax Assessment Total Assessment is a certain percentage of the fair market value that is determined by local assessors to be the total taxable value of land and additions on the property. | Land | Improvement |
|---|---|---|---|---|
| 2025 | $738 | $27,064 | $3,240 | $23,824 |
| 2024 | $658 | $24,144 | $3,240 | $20,904 |
| 2023 | $548 | $20,104 | $3,240 | $16,864 |
| 2022 | $538 | $19,264 | $3,240 | $16,024 |
| 2021 | $582 | $19,292 | $2,320 | $16,972 |
| 2020 | $582 | $19,292 | $2,320 | $16,972 |
| 2019 | $557 | $18,452 | $2,320 | $16,132 |
| 2018 | $553 | $18,328 | $2,196 | $16,132 |
| 2017 | $553 | $18,328 | $2,196 | $16,132 |
| 2016 | $553 | $18,328 | $2,196 | $16,132 |
| 2015 | $554 | $18,328 | $2,196 | $16,132 |
| 2014 | $555 | $18,344 | $2,196 | $16,148 |
| 2013 | -- | $19,845 | $2,196 | $17,649 |
Source: Public Records
Map
Nearby Homes
- 626 Smoot St
- 510 Smoot St
- 0 Brown St Unit 10550761
- 0 Brown St Unit 10550754
- 0 E Fendig St
- 113 E Fendig St
- 200 Mccall St
- 901 Whiteline St
- 203 Revis St
- 205 Revis St
- 0 Burr St
- 306 Burr St
- 0 Kelley St Unit 10550311
- 105 Dix St
- 957 Kelley St
- 109 Bell St
- 130 Edgewood Ave
- 1017 Mason St
- 0 Mason St Unit E102667
- 0 Locust St
Your Personal Tour Guide
Ask me questions while you tour the home.