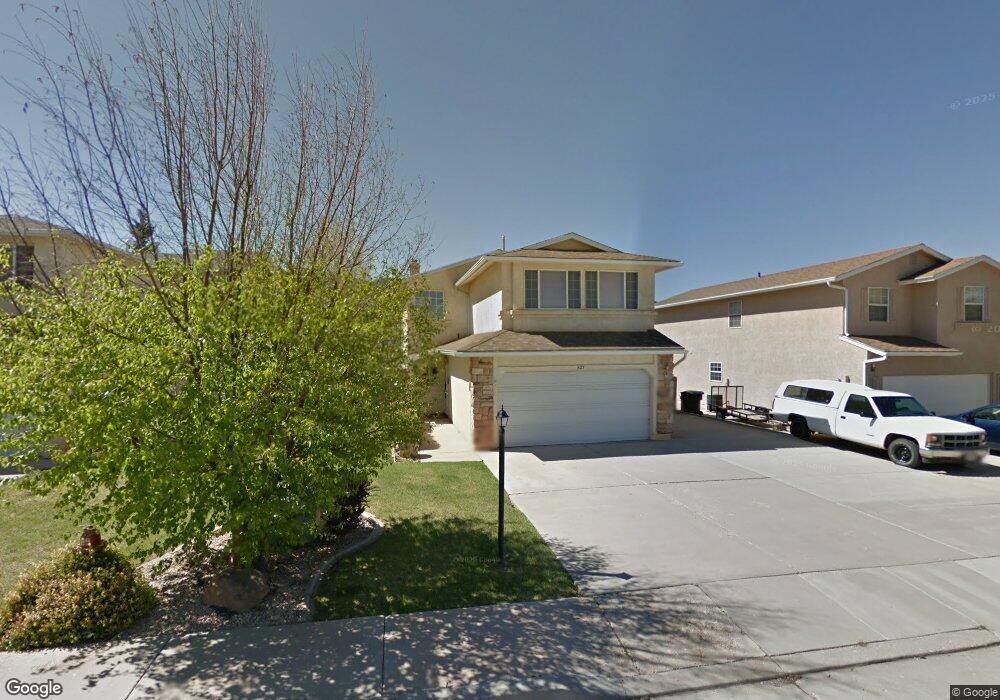
627 W 60 N Parowan, UT 84761
Estimated Value: $320,000 - $383,000
3
Beds
3
Baths
2,088
Sq Ft
$170/Sq Ft
Est. Value
About This Home
This home is located at 627 W 60 N, Parowan, UT 84761 and is currently estimated at $355,793, approximately $170 per square foot. 627 W 60 N is a home located in Iron County with nearby schools including Parowan School, Parowan High School, and Cedar City High School.
Ownership History
Date
Name
Owned For
Owner Type
Purchase Details
Closed on
Jan 3, 2018
Sold by
Garcia Rocio Diaz
Bought by
Garcia Rocio and Rocio Diaz Garcia Trust
Current Estimated Value
Purchase Details
Closed on
Oct 17, 2014
Sold by
Garcia Rocio and Rocio Diaz Garcia Trust
Bought by
Garcia Rocio Diaz
Home Financials for this Owner
Home Financials are based on the most recent Mortgage that was taken out on this home.
Original Mortgage
$53,667
Outstanding Balance
$40,885
Interest Rate
3.93%
Mortgage Type
Commercial
Estimated Equity
$314,908
Purchase Details
Closed on
Jun 2, 2011
Sold by
Carlos Rocio Garcia
Bought by
Catering Bugsys
Create a Home Valuation Report for This Property
The Home Valuation Report is an in-depth analysis detailing your home's value as well as a comparison with similar homes in the area
Home Values in the Area
Average Home Value in this Area
Purchase History
| Date | Buyer | Sale Price | Title Company |
|---|---|---|---|
| Garcia Rocio | -- | Cedar Land Title Inc | |
| Garcia Rocio Diaz | -- | Cedar Land Title Inc | |
| Catering Bugsys | -- | -- |
Source: Public Records
Mortgage History
| Date | Status | Borrower | Loan Amount |
|---|---|---|---|
| Open | Garcia Rocio Diaz | $53,667 |
Source: Public Records
Tax History Compared to Growth
Tax History
| Year | Tax Paid | Tax Assessment Tax Assessment Total Assessment is a certain percentage of the fair market value that is determined by local assessors to be the total taxable value of land and additions on the property. | Land | Improvement |
|---|---|---|---|---|
| 2025 | $2,795 | $346,856 | $47,438 | $299,418 |
| 2023 | $2,708 | $343,245 | $47,435 | $295,810 |
| 2022 | $2,773 | $289,630 | $43,125 | $246,505 |
| 2021 | $1,913 | $199,840 | $17,250 | $182,590 |
| 2020 | $2,037 | $187,990 | $17,250 | $170,740 |
| 2019 | $1,898 | $167,105 | $17,250 | $149,855 |
| 2018 | $1,913 | $164,855 | $15,000 | $149,855 |
| 2017 | $1,730 | $145,455 | $15,000 | $130,455 |
| 2016 | $1,679 | $133,660 | $15,000 | $118,660 |
| 2015 | $1,684 | $126,605 | $0 | $0 |
| 2014 | $1,765 | $126,605 | $0 | $0 |
Source: Public Records
Map
Nearby Homes