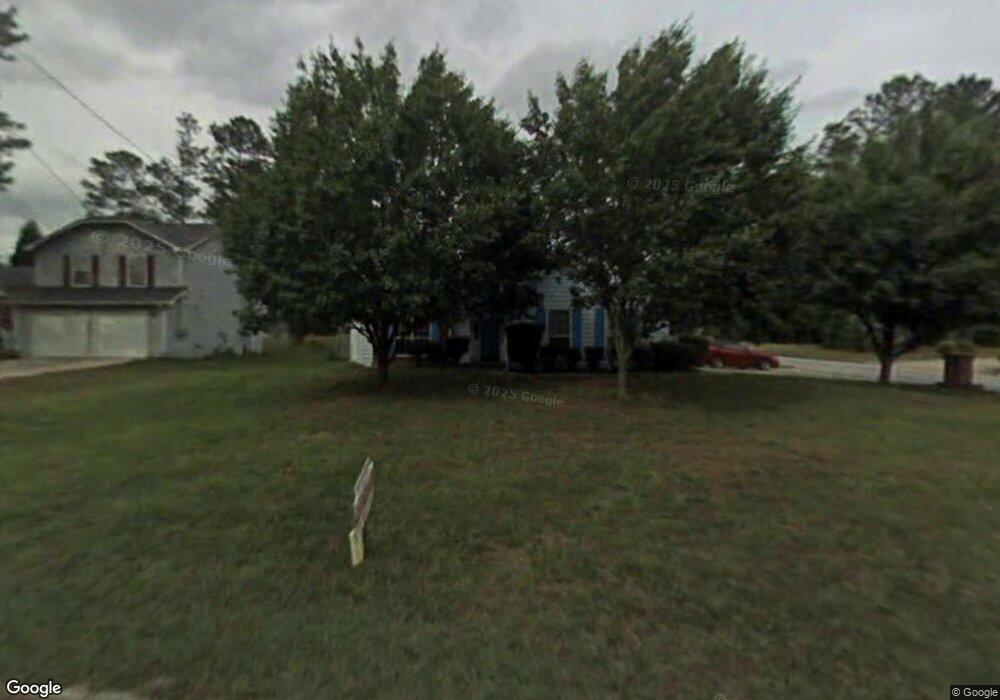
6270 Hemperly Rd Atlanta, GA 30349
Estimated Value: $226,306 - $273,000
3
Beds
2
Baths
1,789
Sq Ft
$135/Sq Ft
Est. Value
About This Home
This home is located at 6270 Hemperly Rd, Atlanta, GA 30349 and is currently estimated at $240,827, approximately $134 per square foot. 6270 Hemperly Rd is a home located in Fulton County with nearby schools including Mcnair Middle School, Banneker High School, and Hapeville Charter Career Academy.
Ownership History
Date
Name
Owned For
Owner Type
Purchase Details
Closed on
Jun 30, 2010
Sold by
Bridgecrossing Llc
Bought by
Steward Monica
Current Estimated Value
Home Financials for this Owner
Home Financials are based on the most recent Mortgage that was taken out on this home.
Original Mortgage
$91,065
Outstanding Balance
$61,712
Interest Rate
5.12%
Mortgage Type
FHA
Estimated Equity
$179,115
Purchase Details
Closed on
Aug 10, 2009
Sold by
Jpmc Specialty Mortgage Llc
Bought by
Lavera Llc
Purchase Details
Closed on
May 5, 2009
Sold by
Ochoa Roberto
Bought by
Jpmc Specialty Mortgage Llc
Purchase Details
Closed on
Oct 19, 1993
Sold by
Pearson Susan L
Bought by
Heslin Patricia
Home Financials for this Owner
Home Financials are based on the most recent Mortgage that was taken out on this home.
Original Mortgage
$85,650
Interest Rate
6.75%
Mortgage Type
FHA
Create a Home Valuation Report for This Property
The Home Valuation Report is an in-depth analysis detailing your home's value as well as a comparison with similar homes in the area
Home Values in the Area
Average Home Value in this Area
Purchase History
| Date | Buyer | Sale Price | Title Company |
|---|---|---|---|
| Steward Monica | $93,100 | -- | |
| Lavera Llc | $31,500 | -- | |
| Jpmc Specialty Mortgage Llc | $44,288 | -- | |
| Heslin Patricia | $106,400 | -- |
Source: Public Records
Mortgage History
| Date | Status | Borrower | Loan Amount |
|---|---|---|---|
| Open | Steward Monica | $91,065 | |
| Previous Owner | Heslin Patricia | $85,650 |
Source: Public Records
Tax History Compared to Growth
Tax History
| Year | Tax Paid | Tax Assessment Tax Assessment Total Assessment is a certain percentage of the fair market value that is determined by local assessors to be the total taxable value of land and additions on the property. | Land | Improvement |
|---|---|---|---|---|
| 2025 | $3,323 | $99,680 | $19,600 | $80,080 |
| 2023 | $2,287 | $81,040 | $21,400 | $59,640 |
| 2022 | $2,167 | $55,280 | $6,440 | $48,840 |
| 2021 | $2,147 | $53,640 | $6,240 | $47,400 |
| 2020 | $2,157 | $53,000 | $6,160 | $46,840 |
| 2019 | $1,242 | $31,440 | $4,680 | $26,760 |
| 2018 | $1,224 | $30,760 | $4,600 | $26,160 |
| 2017 | $530 | $13,000 | $2,440 | $10,560 |
| 2016 | $530 | $13,000 | $2,440 | $10,560 |
| 2015 | $531 | $13,000 | $2,440 | $10,560 |
| 2014 | $561 | $13,000 | $2,440 | $10,560 |
Source: Public Records
Map
Nearby Homes
- 6265 Gemstone Ct
- 6037 Hemperly Rd
- 6041 Hemperly Rd
- 6305 Emerald Pointe Cir
- 0 Flat Shoals Rd Unit 10214526
- 0 Flat Shoals Rd Unit 7513975
- 6148 Hemperly Rd
- 2890 Kayla Ct
- 6278 Rockaway Rd
- 2764 Ocean Valley Dr
- 2765 Ocean Valley Dr
- 1005 Winter Side Ln Unit 2
- 1005 Winterside Ln
- 6022 Centennial Run
- 2802 Ocean Valley Dr
- 2970 Harper Valley Dr
- 340 Onyx Ct
- 2765 Old Farm Rd
- 6260 Hemperly Rd
- 6600 Emerald Pointe Cir
- 0 Emerald Pointe Cir Unit 3227760
- 0 Emerald Pointe Cir Unit 2925964
- 0 Emerald Pointe Cir Unit 8665846
- 0 Emerald Pointe Cir Unit 3276683
- 0 Emerald Pointe Cir Unit 7020216
- 0 Emerald Pointe Cir Unit 8606226
- 0 Emerald Pointe Cir Unit 8684592
- 0 Emerald Pointe Cir Unit 8229070
- 0 Emerald Pointe Cir Unit 7334805
- 0 Emerald Pointe Cir Unit 9050876
- 0 Emerald Pointe Cir Unit 9062400
- 0 Emerald Pointe Cir Unit 3113792
- 0 Emerald Pointe Cir Unit 3170623
- 0 Emerald Pointe Cir Unit 3186752
- 0 Emerald Pointe Cir Unit 3211295
- 0 Emerald Pointe Cir Unit 7520439
- 0 Emerald Pointe Cir
- 6655 Emerald Pointe Cir