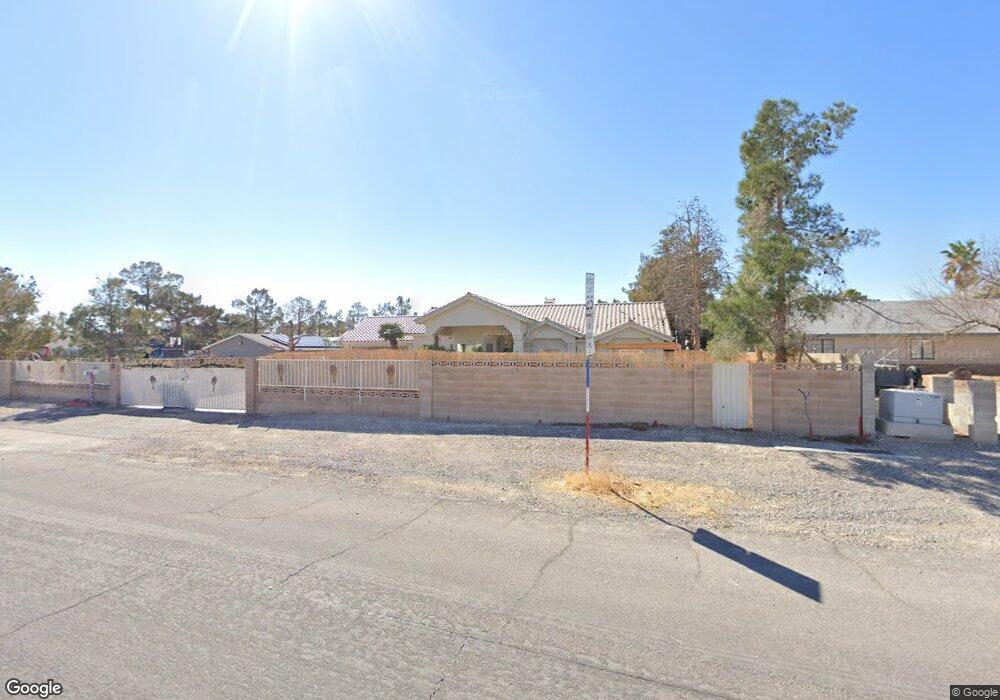
6271 Fisher Ave Las Vegas, NV 89130
North Cheyenne NeighborhoodEstimated Value: $604,000 - $686,974
4
Beds
3
Baths
2,314
Sq Ft
$276/Sq Ft
Est. Value
About This Home
This home is located at 6271 Fisher Ave, Las Vegas, NV 89130 and is currently estimated at $637,744, approximately $275 per square foot. 6271 Fisher Ave is a home located in Clark County with nearby schools including Ernest May Elementary School, Theron L Swainston Middle School, and Shadow Ridge High School.
Ownership History
Date
Name
Owned For
Owner Type
Purchase Details
Closed on
Mar 13, 1998
Sold by
Covert Laura L and Covert Vergara Laura L
Bought by
Vergara Conrad
Current Estimated Value
Home Financials for this Owner
Home Financials are based on the most recent Mortgage that was taken out on this home.
Original Mortgage
$150,000
Outstanding Balance
$27,659
Interest Rate
7.11%
Estimated Equity
$610,085
Purchase Details
Closed on
May 21, 1997
Sold by
Ickes Howard William
Bought by
Vergara Conrad and Covert Vergara Laura L
Home Financials for this Owner
Home Financials are based on the most recent Mortgage that was taken out on this home.
Original Mortgage
$97,000
Interest Rate
8.13%
Purchase Details
Closed on
Dec 20, 1996
Sold by
Ickes Holly
Bought by
Ickes Howard William
Home Financials for this Owner
Home Financials are based on the most recent Mortgage that was taken out on this home.
Original Mortgage
$180,000
Interest Rate
7.59%
Create a Home Valuation Report for This Property
The Home Valuation Report is an in-depth analysis detailing your home's value as well as a comparison with similar homes in the area
Home Values in the Area
Average Home Value in this Area
Purchase History
| Date | Buyer | Sale Price | Title Company |
|---|---|---|---|
| Vergara Conrad | -- | Nevada Title Company | |
| Vergara Conrad | $212,000 | Stewart Title | |
| Ickes Howard William | -- | National Title Company |
Source: Public Records
Mortgage History
| Date | Status | Borrower | Loan Amount |
|---|---|---|---|
| Open | Vergara Conrad | $150,000 | |
| Closed | Vergara Conrad | $97,000 | |
| Previous Owner | Ickes Howard William | $180,000 |
Source: Public Records
Tax History Compared to Growth
Tax History
| Year | Tax Paid | Tax Assessment Tax Assessment Total Assessment is a certain percentage of the fair market value that is determined by local assessors to be the total taxable value of land and additions on the property. | Land | Improvement |
|---|---|---|---|---|
| 2025 | $3,341 | $174,684 | $61,250 | $113,434 |
| 2024 | $2,502 | $174,684 | $61,250 | $113,434 |
| 2023 | $2,502 | $147,857 | $61,250 | $86,607 |
| 2022 | $2,429 | $123,158 | $43,750 | $79,408 |
| 2021 | $2,358 | $117,681 | $42,000 | $75,681 |
| 2020 | $2,287 | $113,482 | $38,500 | $74,982 |
| 2019 | $2,220 | $100,313 | $26,250 | $74,063 |
| 2018 | $2,155 | $105,979 | $34,300 | $71,679 |
| 2017 | $3,372 | $102,874 | $34,300 | $68,574 |
| 2016 | $2,041 | $91,965 | $22,750 | $69,215 |
| 2015 | $2,037 | $60,286 | $17,063 | $43,223 |
| 2014 | $1,977 | $79,861 | $18,200 | $61,661 |
Source: Public Records
Map
Nearby Homes
- 6301 Malachite Bay Ave
- 5329 Bright Sun Ct
- 6129 Desert Haven Rd
- 5144 Maverick St
- 6113 Desert Haven Rd
- 6405 Break Point Ave
- 6112 Browning Way
- 6109 Sandstone Mesa Dr
- 6345 Citrine Ave
- 5260 N Jones Blvd
- 6345 Cinnabar Ridge Ave
- 5508 Jasper Butte St
- 6406 Veranda Falls Ct
- 6405 Steamship Ct
- 5620 N Jones Blvd
- 6300 W La Madre Way
- 5005 Chambliss Dr
- 5041 Peaceful Paradise St
- 5876 Tippin Dr
- 5876 Filmore Ave
- 6281 Fisher Ave
- 5260 Maverick St
- 5250 Maverick St
- 6264 Fisher Ave
- 6280 Fisher Ave
- 5240 Maverick St
- 6252 Fisher Ave
- 5270 Mustang St
- 6272 Desert Haven Rd
- 6288 Fisher Ave
- 6268 Desert Haven Rd
- 5260 Mustang St
- 5301 Maverick St
- 6264 Desert Haven Rd
- 6276 Desert Haven Rd
- 6260 Desert Haven Rd
- 5240 Mustang St
- 6292 Fisher Ave
- 5220 Maverick St
- 5305 Maverick St