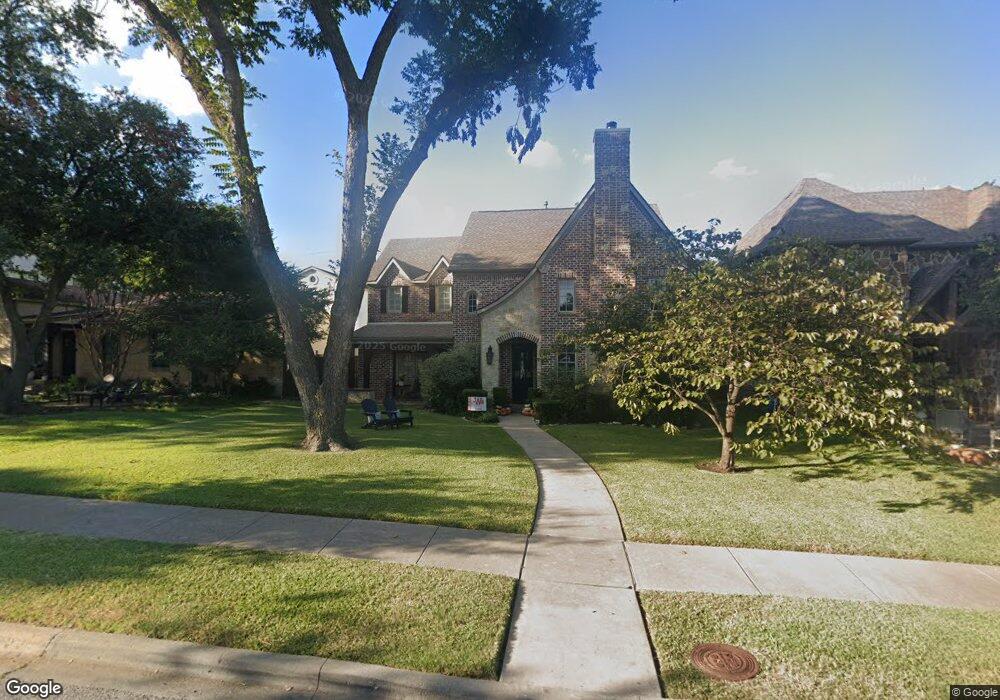
6271 Malcolm Dr Dallas, TX 75214
Lower Greenville NeighborhoodEstimated Value: $1,065,000 - $1,229,000
4
Beds
4
Baths
2,856
Sq Ft
$411/Sq Ft
Est. Value
About This Home
This home is located at 6271 Malcolm Dr, Dallas, TX 75214 and is currently estimated at $1,174,289, approximately $411 per square foot. 6271 Malcolm Dr is a home located in Dallas County with nearby schools including Mockingbird Elementary School, J L Long Middle School, and Woodrow Wilson High School.
Ownership History
Date
Name
Owned For
Owner Type
Purchase Details
Closed on
Apr 13, 2024
Sold by
Hundley Taylor Clay
Bought by
Hundley Sara Jane
Current Estimated Value
Purchase Details
Closed on
Aug 1, 2008
Sold by
Barton Michael L and Barton Kelly Mcchain
Bought by
Hundley Taylor Clay and Hundley Sara Jane
Home Financials for this Owner
Home Financials are based on the most recent Mortgage that was taken out on this home.
Original Mortgage
$564,000
Interest Rate
5.5%
Mortgage Type
Purchase Money Mortgage
Purchase Details
Closed on
Apr 3, 2000
Sold by
Fairey Jeff
Bought by
Barton Michael L and Barton Kelly Mcchain
Home Financials for this Owner
Home Financials are based on the most recent Mortgage that was taken out on this home.
Original Mortgage
$412,000
Interest Rate
8.33%
Purchase Details
Closed on
Apr 22, 1996
Sold by
Ruff Scott T
Bought by
Haney Angela G
Create a Home Valuation Report for This Property
The Home Valuation Report is an in-depth analysis detailing your home's value as well as a comparison with similar homes in the area
Home Values in the Area
Average Home Value in this Area
Purchase History
| Date | Buyer | Sale Price | Title Company |
|---|---|---|---|
| Hundley Sara Jane | -- | None Listed On Document | |
| Hundley Taylor Clay | -- | Rtt | |
| Barton Michael L | -- | -- | |
| Haney Angela G | -- | -- |
Source: Public Records
Mortgage History
| Date | Status | Borrower | Loan Amount |
|---|---|---|---|
| Previous Owner | Hundley Taylor Clay | $564,000 | |
| Previous Owner | Barton Michael L | $412,000 |
Source: Public Records
Tax History Compared to Growth
Tax History
| Year | Tax Paid | Tax Assessment Tax Assessment Total Assessment is a certain percentage of the fair market value that is determined by local assessors to be the total taxable value of land and additions on the property. | Land | Improvement |
|---|---|---|---|---|
| 2025 | $17,541 | $1,070,000 | $492,700 | $577,300 |
| 2024 | $17,541 | $1,090,620 | $492,700 | $597,920 |
| 2023 | $17,541 | $1,041,070 | $454,800 | $586,270 |
| 2022 | $22,629 | $905,010 | $416,900 | $488,110 |
| 2021 | $19,464 | $737,820 | $341,100 | $396,720 |
| 2020 | $20,016 | $737,820 | $341,100 | $396,720 |
| 2019 | $16,901 | $743,300 | $0 | $0 |
| 2018 | $20,212 | $743,300 | $303,200 | $440,100 |
| 2017 | $17,936 | $659,590 | $250,140 | $409,450 |
| 2016 | $18,066 | $664,350 | $250,140 | $414,210 |
| 2015 | $12,295 | $611,070 | $227,400 | $383,670 |
| 2014 | $12,295 | $576,070 | $227,400 | $348,670 |
Source: Public Records
Map
Nearby Homes
- 6231 Mccommas Blvd
- 6215 Mccommas Blvd
- 6129 Mccommas Blvd
- 6222 Ellsworth Ave
- 6218 Ellsworth Ave
- 6117 Martel Ave
- 6211 Marquita Ave
- 6222 Anita St
- 6417 Malcolm Dr
- 6145 Marquita Ave
- 6402 Kenwood Ave
- 6270 Anita St
- 6135 Marquita Ave
- 6227 Anita St
- 6034 Martel Ave
- 6342 Anita St
- 6163 Vanderbilt Ave
- 6026 Monticello Ave
- 6020 Penrose Ave
- 6006 Mercedes Ave
- 6267 Malcolm Dr
- 6275 Malcolm Dr
- 6279 Malcolm Dr
- 6263 Malcolm Dr
- 6270 Revere Place
- 6266 Revere Place
- 6274 Revere Place
- 6262 Revere Place
- 6270 Malcolm Dr
- 6278 Revere Place
- 6266 Malcolm Dr
- 6276 Malcolm Dr
- 6255 Malcolm Dr
- 6262 Malcolm Dr
- 6280 Malcolm Dr
- 6256 Revere Place
- 6284 Revere Place
- 6289 Malcolm Dr
- 6256 Malcolm Dr
- 6286 Malcolm Dr