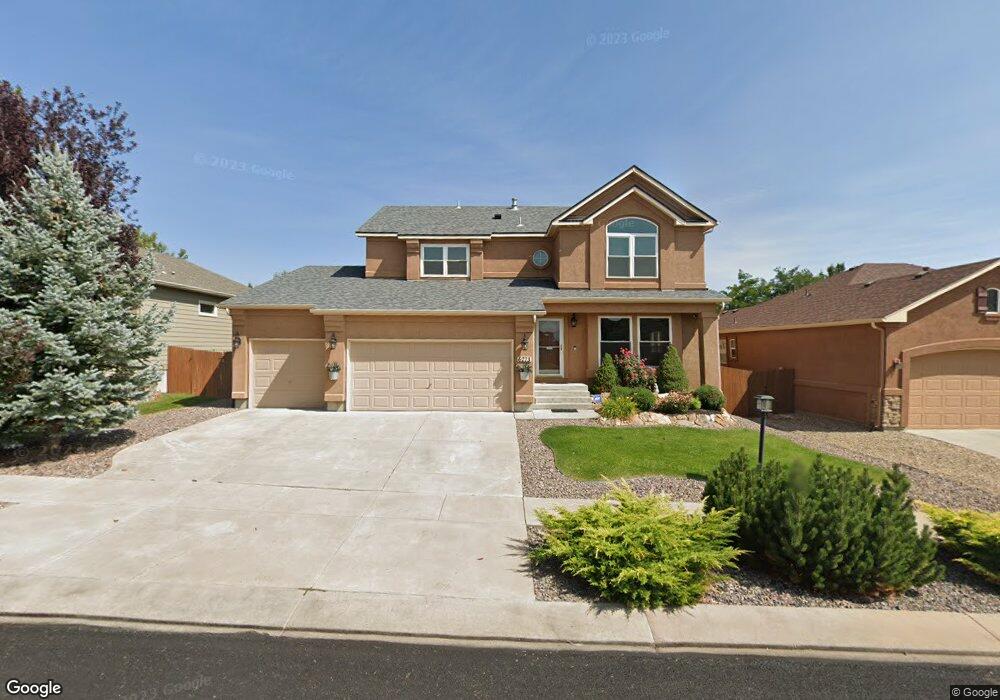
6273 Canyon Crest Loop Colorado Springs, CO 80923
Ridgeview NeighborhoodEstimated Value: $579,965 - $624,000
4
Beds
3
Baths
2,536
Sq Ft
$239/Sq Ft
Est. Value
About This Home
This home is located at 6273 Canyon Crest Loop, Colorado Springs, CO 80923 and is currently estimated at $605,991, approximately $238 per square foot. 6273 Canyon Crest Loop is a home located in El Paso County with nearby schools including Stetson Elementary School, Skyview Middle School, and Sand Creek High School.
Ownership History
Date
Name
Owned For
Owner Type
Purchase Details
Closed on
Aug 30, 2017
Sold by
Gerould Cory L
Bought by
Warren Shane M and Warren Tracie L
Current Estimated Value
Home Financials for this Owner
Home Financials are based on the most recent Mortgage that was taken out on this home.
Original Mortgage
$367,740
Outstanding Balance
$307,583
Interest Rate
3.96%
Mortgage Type
VA
Estimated Equity
$298,408
Purchase Details
Closed on
Nov 6, 2012
Sold by
Brown James E and Brown Wendy L
Bought by
Gerould Cory L
Home Financials for this Owner
Home Financials are based on the most recent Mortgage that was taken out on this home.
Original Mortgage
$253,750
Interest Rate
3.52%
Mortgage Type
VA
Purchase Details
Closed on
Jun 13, 2006
Sold by
Elite Properties Of America Inc
Bought by
Brown James E and Brown Wendy L
Home Financials for this Owner
Home Financials are based on the most recent Mortgage that was taken out on this home.
Original Mortgage
$358,359
Interest Rate
6.58%
Mortgage Type
VA
Create a Home Valuation Report for This Property
The Home Valuation Report is an in-depth analysis detailing your home's value as well as a comparison with similar homes in the area
Home Values in the Area
Average Home Value in this Area
Purchase History
| Date | Buyer | Sale Price | Title Company |
|---|---|---|---|
| Warren Shane M | $360,000 | Land Title Guarantee Co | |
| Gerould Cory L | $275,000 | Empire Title Co Springs Llc | |
| Brown James E | $350,817 | -- |
Source: Public Records
Mortgage History
| Date | Status | Borrower | Loan Amount |
|---|---|---|---|
| Open | Warren Shane M | $367,740 | |
| Previous Owner | Gerould Cory L | $253,750 | |
| Previous Owner | Brown James E | $358,359 |
Source: Public Records
Tax History Compared to Growth
Tax History
| Year | Tax Paid | Tax Assessment Tax Assessment Total Assessment is a certain percentage of the fair market value that is determined by local assessors to be the total taxable value of land and additions on the property. | Land | Improvement |
|---|---|---|---|---|
| 2025 | $2,936 | $38,800 | -- | -- |
| 2024 | $3,137 | $38,870 | $6,470 | $32,400 |
| 2023 | $3,137 | $38,870 | $6,470 | $32,400 |
| 2022 | $2,483 | $27,300 | $5,840 | $21,460 |
| 2021 | $2,604 | $28,090 | $6,010 | $22,080 |
| 2020 | $2,151 | $24,740 | $5,010 | $19,730 |
| 2019 | $2,134 | $24,740 | $5,010 | $19,730 |
| 2018 | $2,120 | $24,280 | $4,380 | $19,900 |
| 2017 | $2,128 | $24,280 | $4,380 | $19,900 |
| 2016 | $2,047 | $23,810 | $4,120 | $19,690 |
| 2015 | $2,049 | $23,810 | $4,120 | $19,690 |
| 2014 | $2,147 | $24,600 | $3,900 | $20,700 |
Source: Public Records
Map
Nearby Homes
- 6292 Tenderfoot Dr
- 5918 Whiskey River Dr
- 6016 Wild Bill Way
- 6380 Tenderfoot Dr
- 5889 Brennan Ave
- 5919 Brennan Ave
- 7127 Indian River Dr
- 6408 Butch Cassidy Blvd
- 7647 Desert Wind Dr
- 7368 Prythania Park Dr
- 6524 Diamond Hitch Dr
- 7199 Quiet Pond Place
- 7737 Desert Wind Dr
- 7525 Stetson Highlands Dr
- 6771 Sunny Alp St
- 7674 Stetson Highlands Dr
- 6530 Van Winkle Dr
- 5625 Dusty Chaps Dr
- 7340 Amberly Dr
- 7607 Eagle Feather Point
- 6267 Canyon Crest Loop
- 6279 Canyon Crest Loop
- 6280 Tin Star Dr
- 6261 Canyon Crest Loop
- 6274 Tin Star Dr
- 6286 Tin Star Dr
- 6268 Tin Star Dr
- 6272 Canyon Crest Loop
- 6255 Canyon Crest Loop
- 6278 Canyon Crest Loop
- 6292 Tin Star Dr
- 6284 Canyon Crest Loop
- 6260 Canyon Crest Loop
- 6262 Tin Star Dr
- 6249 Canyon Crest Loop
- 6290 Canyon Crest Loop
- 6254 Canyon Crest Loop
- 6281 Tin Star Dr
- 6275 Tin Star Dr
- 7314 Wrangler Ridge Dr