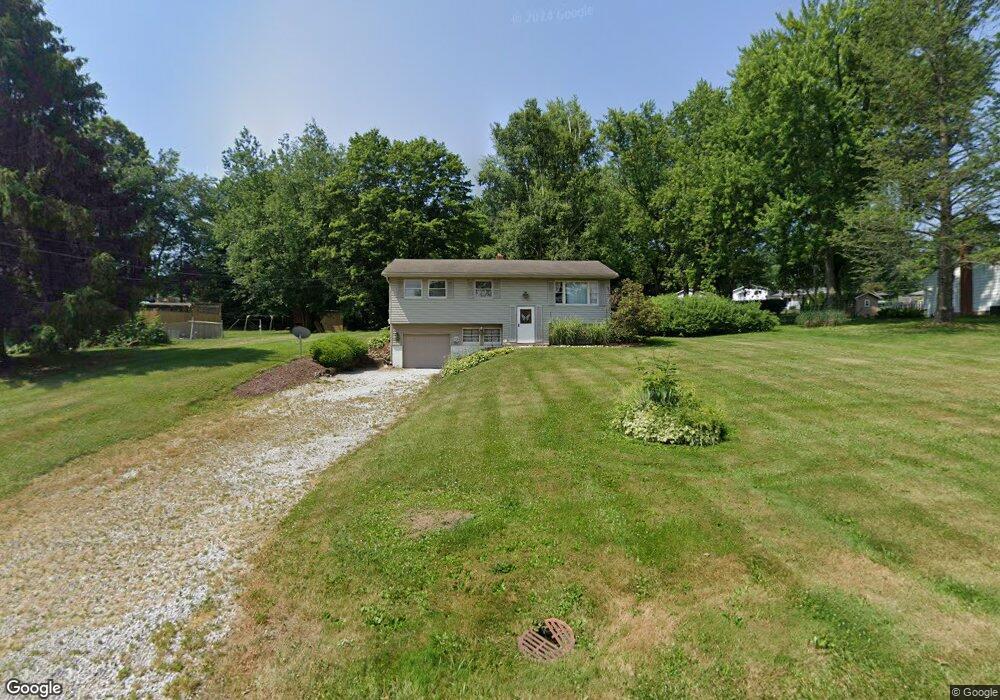
6274 Redbird Terrace Clinton, OH 44216
Estimated Value: $218,206 - $263,000
3
Beds
3
Baths
1,040
Sq Ft
$235/Sq Ft
Est. Value
About This Home
This home is located at 6274 Redbird Terrace, Clinton, OH 44216 and is currently estimated at $244,052, approximately $234 per square foot. 6274 Redbird Terrace is a home located in Summit County with nearby schools including Manchester High School and St. Francis de Sales School.
Ownership History
Date
Name
Owned For
Owner Type
Purchase Details
Closed on
Mar 21, 2022
Sold by
Thomann Darlene K
Bought by
Thomann Angela Lee
Current Estimated Value
Home Financials for this Owner
Home Financials are based on the most recent Mortgage that was taken out on this home.
Original Mortgage
$120,000
Outstanding Balance
$112,418
Interest Rate
4.16%
Mortgage Type
New Conventional
Estimated Equity
$131,634
Purchase Details
Closed on
Mar 17, 2022
Sold by
Thomann Darlene K
Bought by
Thomann Angela Lee
Home Financials for this Owner
Home Financials are based on the most recent Mortgage that was taken out on this home.
Original Mortgage
$120,000
Outstanding Balance
$112,418
Interest Rate
4.16%
Mortgage Type
New Conventional
Estimated Equity
$131,634
Create a Home Valuation Report for This Property
The Home Valuation Report is an in-depth analysis detailing your home's value as well as a comparison with similar homes in the area
Home Values in the Area
Average Home Value in this Area
Purchase History
| Date | Buyer | Sale Price | Title Company |
|---|---|---|---|
| Thomann Angela Lee | $150,000 | Solidifi | |
| Thomann Angela Lee | $150,000 | Solidifi |
Source: Public Records
Mortgage History
| Date | Status | Borrower | Loan Amount |
|---|---|---|---|
| Open | Thomann Angela Lee | $120,000 | |
| Closed | Thomann Angela Lee | $120,000 |
Source: Public Records
Tax History Compared to Growth
Tax History
| Year | Tax Paid | Tax Assessment Tax Assessment Total Assessment is a certain percentage of the fair market value that is determined by local assessors to be the total taxable value of land and additions on the property. | Land | Improvement |
|---|---|---|---|---|
| 2025 | $3,034 | $56,707 | $13,398 | $43,309 |
| 2024 | $2,889 | $56,707 | $13,398 | $43,309 |
| 2023 | $3,034 | $56,707 | $13,398 | $43,309 |
| 2022 | $2,215 | $43,288 | $10,227 | $33,061 |
| 2021 | $2,223 | $43,288 | $10,227 | $33,061 |
| 2020 | $2,184 | $43,290 | $10,230 | $33,060 |
| 2019 | $2,262 | $40,810 | $10,770 | $30,040 |
| 2018 | $1,952 | $40,810 | $10,770 | $30,040 |
| 2017 | $1,883 | $40,810 | $10,770 | $30,040 |
| 2016 | $1,860 | $36,770 | $10,770 | $26,000 |
| 2015 | $1,883 | $36,770 | $10,770 | $26,000 |
| 2014 | $1,868 | $36,770 | $10,770 | $26,000 |
| 2013 | $1,805 | $35,950 | $10,770 | $25,180 |
Source: Public Records
Map
Nearby Homes
- 6387 Hampsher Rd
- 6090 Manchester Rd Unit 6096
- 781 Leeman Dr
- 715 Highland Park Dr
- 6407 Southview Dr
- 451 Yager Rd
- 5983 Weaver Rd
- 7060 Manchester Rd
- 0 W Comet Rd Unit 5079117
- 2200 W Comet Rd
- 8714 Greenmeadow Ave NW
- 0 Babst Ave NW
- 8177 S Cleveland Massillon Rd Unit 16
- 8177 S Cleveland Massillon Rd Unit 42
- 11391 Michelle Dr NW
- 4851 Manchester Rd
- 2543 Shadow Ln
- 765 Longview Ave
- 8941 Shoemaker Ave NW
- 7452 S Cleveland Massillon Rd
- 6284 Redbird Terrace
- 6262 Redbird Terrace
- 6296 Redbird Terrace
- 6248 Redbird Terrace
- 6273 Redbird Terrace
- 6363 Lieb Dr
- 6353 Lieb Dr
- 2708 Redbird Terrace
- 6283 Redbird Terrace
- 6263 Redbird Terrace
- 6308 Redbird Terrace
- 6343 Highland Terrace
- 6337 Lieb Dr
- 6295 Redbird Terrace
- 6251 Redbird Terrace
- 6329 Highland Terrace
- 6353 Highland Terrace
- 6325 Lieb Dr
- 6305 Redbird Terrace
- 6320 Redbird Terrace